Freelists
The freelist technique is used to elicit the elements or members of a cultural domain. For domains that have a name or are easily described, the technique is very simple: just ask a set of informants to list all the members of the domain. For example, you might ask them to list all the names of illnesses that they can recall. If you don't know the name of a domain, you may have to elicit that first. For example, you can ask "what is a mango?" and very likely you will get a response like "a kind of fruit". Then you say "what other kinds of fruit are there?" Note that if a set of items does not have a name in a given culture, it is likely that it is not a domain in that culture. However, you can still obtain a list of related items by asking questions like "what else is there that is like a mango?".
At first glance, the freelist technique may appear to be the same as any open-ended question, such as "What illnesses have you had?" The difference is that freelisting is used to elicit cultural domains, and open-ended questions are used to elicit information about the informant (see Table 1). In principle, the freelists from different respondents (belonging to the same culture) should be comparable and similar because the stimulus question is about something outside themselves and which they have in common with other members. In contrast, an open-ended question could easily generate only unique answers.
Table 1. Comparison of Freelist and Open-Ended Questions
| Type of Question | Example | Objective |
|---|---|---|
| Freelist question | What illnesses are there? | Learn about the domain (e.g. develop list of named illnesses) |
| Survey open-end | What illnesses have you had? | Learn about the respondent (e.g. obtain patient history) |
Collecting Freelist Data
Ordinarily, freelists are obtained as part of a semi-structured interview, not an informal conversation. With literate informants, it is easiest to ask the respondents to write down all the items they can think of, one item per line, on a piece of paper. The exact same question is asked of the entire sample of respondents (see below for a discussion of sample size). We then count the number of times each item is mentioned and sort in order of decreasing frequency. For example, I asked 14 undergraduates at Boston College to list all the animals they could think of. On average, each person listed 21.6 animal terms. The top twenty terms are given in Table 2.
Table 2. Top 20 Animals Mentioned, Ordered by Frequency
| Rank | Item Name | Freq. | Resp. % | Avg. Rank | Smith's S |
| 1 | CAT | 13 | 93 | 4.85 | 0.758 |
| 2 | DOG | 13 | 93 | 3.62 | 0.814 |
| 3 | ELEPHANT | 10 | 71 | 8.20 | 0.471 |
| 4 | ZEBRA | 9 | 64 | 11.11 | 0.341 |
| 5 | SQUIRREL | 8 | 57 | 12.88 | 0.266 |
| 6 | TIGER | 8 | 57 | 5.50 | 0.440 |
| 7 | COW | 7 | 50 | 10.86 | 0.291 |
| 8 | FISH | 7 | 50 | 13.29 | 0.224 |
| 9 | BEAR | 7 | 50 | 7.00 | 0.366 |
| 10 | WHALE | 7 | 50 | 13.86 | 0.215 |
| 11 | DEER | 7 | 50 | 11.29 | 0.259 |
| 12 | MONKEY | 7 | 50 | 10.00 | 0.293 |
| 13 | GIRAFFE | 6 | 43 | 12.00 | 0.228 |
| 14 | GORILLA | 6 | 43 | 14.67 | 0.146 |
| 15 | MOUSE | 6 | 43 | 8.83 | 0.299 |
| 16 | SNAKE | 6 | 43 | 13.33 | 0.180 |
| 17 | LION | 5 | 36 | 11.00 | 0.199 |
| 18 | ANTELOPE | 5 | 36 | 11.00 | 0.197 |
| 19 | LEOPARD | 5 | 36 | 12.40 | 0.166 |
| 20 | TURTLE | 5 | 36 | 7.80 | 0.238 |
The number of informants needed depends on the amount of cultural consensus in the population of interest -- if every informant gives the exact same answers, you only need one -- but a conventional rule-of-thumb is to obtain a minimum of 30 lists. One heuristic for determining whether it is necessary to interview more informants, recommended by Gery Ryan(3), is to compute the frequency count after 20 or so randomly chosen informants, then again after 30. If the relative frequencies of the top items have not changed, it suggests that no more informants are needed. In contrast, if the relative frequencies have changed, this indicates that the structure has not yet stabilized and you need more informants. This procedure only works if the respondents are being sampled at random from the population of interest. If, for example, the domain is illnesses and the first 20 respondents are all nurses, the method might indicate that no more respondents are needed. Yet if the results are intended to represent more than just nurses, more (non-nurse) respondents will be needed.
The frequency of items is usually interpreted in terms of salience. That is, items that are frequently mentioned are assumed to be highly salient to respondents, so that few forget to mention those items. Another aspect of salience, however, is how soon the respondent recalls the item. Items recalled first are assumed to be more salient than items recalled last. The second column from the right in Table 2 gives the average position or rank of each item on each individual's list. With sufficient respondents (more than used in Table 2), it is often the case that a strong negative correlation exists between the frequency of the items and their average rank, at least for the items mentioned by a majority of respondents. This means that the higher the probability that a respondent mentions an item, the more likely it is that they will mention it early. This supports the notion of salience as a latent variable that determines both whether an item is mentioned and when. In recognition that frequency and average rank are both reflections of the same underlying property (salience), some researchers like to combine the two into a single measure. One such measure, Smith's S (Smith, 1997), is given in the rightmost column of Table 2. The measure is essentially a frequency count that is weighted inversely by the rank of the item in each list. In practice, Smith's S tends to be very highly correlated with simple frequency.
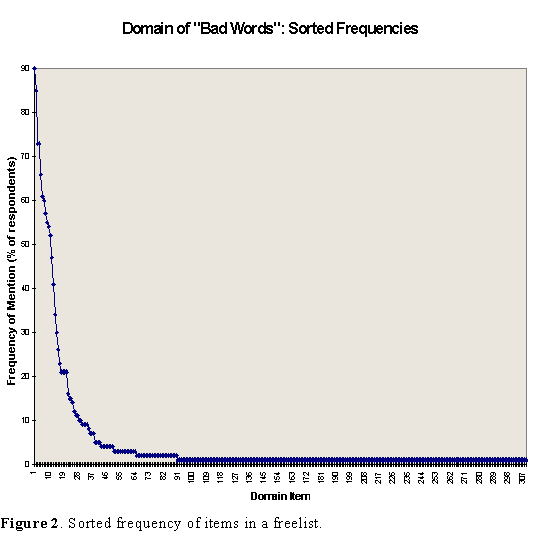
Once the freelists have been collected and tabulated, one thing that usually becomes apparent is that there are a few items that are mentioned by many respondents, and a huge number of items that are each mentioned by just one person. For example, I collected freelist data on the domain of "bad words" from 92 undergraduate students at the University of South Carolina. A total of 309 distinct items were obtained, of which 219 (71%) were mentioned by just one person (see Figure 2). As discussed near the end of this section, domains seem to have a core/periphery sort of structure with no absolute boundary. The more respondents you have, the longer the periphery (the right-hand tail in Figure 2) grows, though ever more slowly.

From a practical point of view, of course, it is usually necessary to determine a boundary for the domain one is studying. One natural approach is to count as members of the domain all items that are mentioned by more than one respondent. This is logical because cultural domains are shared at least to some extent, and it is hard to argue that an item mentioned by just one person is shared. However, this approach usually does not cut down the number of items enough for further research. Another approach is to look for a natural break or "elbow" in the sorted list of frequencies.(4) This is most easily done by plotting the frequencies in what is known as a "scree plot" (see Figure 2). When such a break can be found it is very convenient, and may well reflect a real difference between the culturally shared items of the domain and the idiosyncratic items. But if no break is present, it is ultimately necessary to arbitrarily choose the top N items, where N is the largest number you can really handle in the remaining part of the study. In Figure 2, no really clear breaks are present, but there are three "mini-breaks" that one might consider. In the sorted list of words, they occur after the 20th, 26th, and 40th words.
One problem that must be dealt with before computing frequencies is the occurrence of synonyms, variant spellings, subdomain names, and the use of modifiers. For instance, in the "bad words" domain, some of the terms elicited were "whore", "ho", and "hore". It is likely that "whore" and "hore" are variant spellings of the same word, and therefore pose no real dilemma. In contrast, "ho", which was used primarily by African-American students, could conceivably have a somewhat different meaning. (There is always this potential when a word is used more often by one ethnic group than by others.) Similarly, in the domain of animals, the terms "aardvark" and "anteater" are synonymous for most people, but for some (including biologists), "anteater" refers to a general class of animals of which the aardvark is just one. Whether they should be treated as synonyms or not will depend on the purposes of the study. It may be necessary, before continuing, to ask respondents whether "aardvark" means the same thing as "anteater".
Occasionally, respondents will fall into a response set in which they list a class of items separated by modifiers. For example, they may name "grizzly bear", "Kodiak bear", "black bear", and "brown bear". Obviously, these constitute subclasses of bear that may be at a lower level of contrast than other terms in their lists. Occasionally, these kinds of items may lead respondents to generalize, so that they list "large dog", "small dog", and "hairless dog". In general these are not a problem because they will be mentioned by just one person, and so will be dropped from further consideration.
Analyzing Freelist Data
While the main purpose of the freelisting exercise is to obtain the membership list for a domain, the lists can also be used as ends in themselves. That is, there are several interesting analyses that can be done with such lists.
Table 3. Portion of Respondent-by-Item Freelist Matrix
| Items | ||||||||||||||||||||||||||||||||||||||||||||||||||||||||||||||||||||||||||||||||||||||||||||||||||||
|---|---|---|---|---|---|---|---|---|---|---|---|---|---|---|---|---|---|---|---|---|---|---|---|---|---|---|---|---|---|---|---|---|---|---|---|---|---|---|---|---|---|---|---|---|---|---|---|---|---|---|---|---|---|---|---|---|---|---|---|---|---|---|---|---|---|---|---|---|---|---|---|---|---|---|---|---|---|---|---|---|---|---|---|---|---|---|---|---|---|---|---|---|---|---|---|---|---|---|---|---|
| Respondents |
|
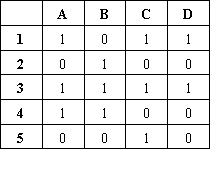
Once we have a master list of all items mentioned, we can arrange the freelist data as a matrix in which the rows are informants and the columns are items (see Table 3). The cells of the matrix can contain ones (if the respondent in a given row mentioned the item in a given column) or zeros (that respondent did not mention that item). Taking column sums of the matrix would give us the item frequencies. Taking column averages would give us the proportion of respondents mentioning each item. Taking row sums would give us the number of items in each person's freelist.
The number of items in an individual's freelist is interesting in itself. Although perhaps confounded by such variables as respondent intelligence, motivation and personality, it seems plausible that the number of items listed reflects a person's familiarity with the domain (Gatewood, 1984). For example, if we ask people to list all sociological theories of deviance they can think of, we should expect to find that professional sociologists have longer lists than most people. Similarly, dog fanciers are likely to produce longer lists of dog breeds than ordinary people. Yet length of list is obviously not the whole story as respondents who are relatively unfamiliar with a domain can produce impressively long lists of very unusual items -- items which other respondents would not agree with.
To construct a better measure of domain familiarity (or "cultural domain competence") we could weight the items in an individual freelist by the proportion of respondents who mention the item. Adding up the weights of the items in a respondent's freelist then gives a convenient measure of cultural competence. Respondents score high on this measure to the extent that they mention many high-frequency items and avoid mentioning low-frequency items.
 |
 |
| a) Respondent-by-item freelist matrix | b) Item-by-item matrix of co-occurrences |
Figure 3. Computing co-occurrence.
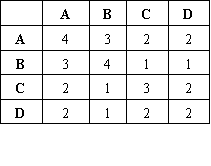
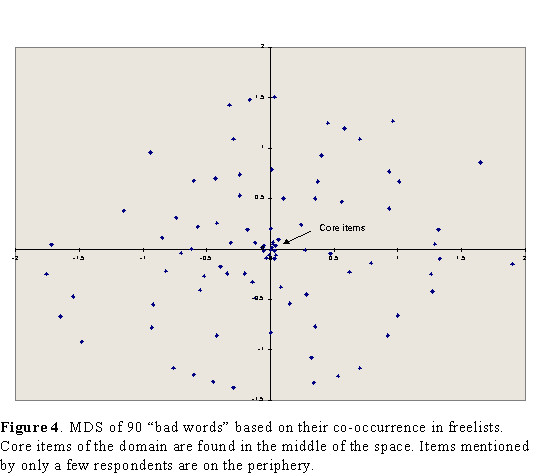
Another kind of analysis of freelist data -- now focusing on the items rather than the respondents -- is to examine the co-occurrences among freelisted items. Figure 3a gives an excerpt from a respondent-by-item freelist matrix. There are four items labeled A through D. Consider items A and B. Each are mentioned by four respondents. Three respondents mention both of them. That is, A and B co-occur in three of the six freelists. By comparing every pair of items, we can construct the item-by-item matrix given in Figure 3b. This matrix can then be displayed via multidimensional scaling (MDS), as shown in Figure 4. In a multidimensional scaling map of this kind, two items are close together to the extent that many respondents mentioned both items. Items that are far apart on the map were rarely mentioned by the same respondents.

Typically, such maps will have a core/periphery structure in which the core members of the domain (i.e., the most frequently mentioned) will be at the center, with the rest of the items spreading away from the core and the most idiosyncratic items located on the far periphery. The effect is similar to a fried egg.(5)
A number of other analyses of freelist data may be made as well. As Henley (1969) noticed, the order in which items are listed by individual respondents is not arbitrary. Instead, we find that respondents will produce runs of similar items, one quickly following the other, followed by a visible pause, and then a new run will begin of different items. Even if we do not record the pauses, we can recover a great deal of information about the cognitive structuring of the domain by examining the relative position of items on the list. Two factors seems to affect position on the list. First, as mentioned earlier, the more central items tend to occur first. When we ask North Americans to list all animals, "cat" and "dog" tend to be at the top of each person's list, and they tend to be mentioned by everyone.
Second, related items tend to be mentioned near each other (i.e., the difference in their ranks is small). Hence, we can use the differences in ranks for each pair of items as a rough indicator of the cognitive similarity of the items. To do this, we construct a new person-by-item matrix in which the cells contain ranks rather than ones and zeros. For example, if respondent "Jim" listed item "Deer" as the 7th item on his freelist, then we would enter a "7" in the cell corresponding to his row and the deer column. If a respondent did not mention an item at all, we enter a special code denoting a missing value (NOT a zero). Then we compute correlations (or distances) among the columns of the matrix. The result is an item-by-item matrix indicating how similarly items are positioned in people's lists, when they occur at all. This can then be displayed using multidimensional scaling. It should be noted, however, that if the primary interest of the study is to uncover similarities among the members of a domain, it is probably wise to use more direct methods, such as those outlined in the next section.
It should also be noted that while we reserve the term "freelisting" for the relatively formal elicitation task described here, the basic idea of asking informants for examples of a conceptual category is very useful even in informal interviews (Spradley 1979). For example, in doing an ethnography of an academic department, we might find ourselves asking an informant "You mentioned that there are a number of ways that graduate students can screw up. Can you give me some examples?" Rather than eliciting all the members of the domain, the objective might be simply to elicit just one element, which then becomes the vehicle for further exploration.
It is also possible to reverse the question and ask the respondent if a given item belongs to the domain, and if not, why not. The negative examples help to elicit the characteristics that are shared by all members of the domain and which therefore might otherwise go unmentioned.
3. Personal communication
4. Or salience, as captured by Smith's S.
5. While not an artifact, exactly, of the column sums of the matrix (i.e., some items are mentioned more often than others), the core/periphery structure of co-occurrence matrices is made visible by not controlling for the sums. It is also useful to examine the pattern obtained by controlling for these sums. One way to do this is to simply compute Pearson correlations among the columns. Another way is to count both matches of the ones and the zeros.