To do this paper, the lead writers will need to interview their teammates about a lot of sensitive issues. To read more about networks, link to the handout on Intra-Organizational Networks.
Part A. Data.
1. Estimate the amount of task-related interaction between each pair of persons in your team. Record the information in a matrix as show below.
The numbers in the matrix should be quantities between 100 and infinity. Let 100 represent the amount of interaction of the two people who interact the least. This will be the baseline from which you will figure all the other numbers. For example, suppose that Mary and Gerry interact the least in your group. Then give them 100. Now suppose that Gerry and Jill interact about 15% more often than Mary and Gerry. Give them 115. Similarly, if Mary and Jill interact four times as much as Mary and Gerry, give them 400.
Task-Related Interactions
| Mary | Gerry | Jill | Bill | |
| Mary | --- | 100 | 400 | 500 |
| Gerry | 100 | --- | 115 | 500 |
| Jill | 400 | 115 | --- | 1000 |
| Bill | 500 | 500 | 1000 | --- |
2. Estimate the amount of purely social interaction between each pair of persons in your group. Record the information in a matrix as in Item 1.
3. Think about the flows of information/ideas from person to person. Estimate the amount of flow of substantive suggestions/ideas from each person to each other person. By "substantive suggestions" I mean things like contributions to tasks. Create a matrix as in Item 1.
4. Think about the flows of process-related commentary from person to person. By "process-related commentary" I mean suggestions about how the group should organize itself, when to meet, whether somebody should speak up more, etc. In other words, talk about how the group should function, rather than talk about a specific task. Create a matrix as in Item 1.
5. Estimate the overall similarity in personal style among each pair of persons in the group. Use the same number scale and matrix format as in Item 1.
6. In a matrix, record how well each pair of persons knew each other before the class. If a given pair did not know each other before at all, assign them a score of "0". If they knew each other, but were just acquaintances, assign a score of "100". If a pair knew each other twice as well as the pair that were just acquaintances, give them a score of "200", and so on.
Part B. Diagrams
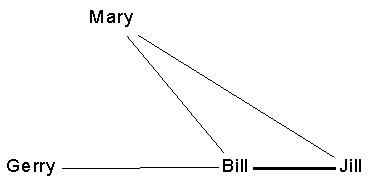
1. Draw network diagrams corresponding to each of your data matrices. In order to make the diagrams readable, you will have to simplify a bit. For example, to diagram the first matrix (Item 1 in Part A), you might decide that all numbers less than 334 will be recoded as zero (absent), numbers between 334 and 666 will be recoded as one, and numbers higher than 666 will be recoded as two. Then you draw lines between the people using widths proportional to the recoded values. For example:
Notice that Bill and Jill get a thick line, because of their strong relationship. Notice that Mary and Gerry get no line at all (and neither do Gerry and Jill) because their relationship is weak.
It is also helpful to place the points in such a way that (a) there are few crossed lines, and (b) the distance between points is inversely proportional to their relationship. For example, Bill and Jill are placed more closely together than any other pair because of their strong relationship. Mary and Gerry are equally far from Bill because they are equally strongly related to Bill. It doesn't have to be perfect, but some attention to spatial relationships is helpful.
Questions to answer:
1. What is the structure of your group? Two cliques? A core-periphery pattern? No structure at all -- diffuse ties among all persons with no obvious pattern? How does the fact that not all pairs of persons are equally strongly related affect group functioning (how you organize for assignments, how well you perform)?
2. Who is central in the group? Central means that (a) they have many strong links, (b) they are a short distance (counted in links) from all others, (c) they are often "between" two others (i.e., the shortest paths between pairs of persons tend to pass through a certain person). Why are they so central? Why are the peripheral people peripheral?
3. Analyze the diagrams and data in terms of implications for group dynamics. Do the network relationships help to explain what happens in your team? For example suppose person A interacts a lot with everybody, but persons B and C hardly interact at all. Does this result in person A being used as an intermediary for B and C?
Do you have situations where A is close with B, and B is close with C, but A is not close with C? If so, is this uncomfortable for those involved? Are they even aware of it?
4. What explains why some people in the group interact with each other more than others? Test this hypothesis: similarity leads to friendship which leads to interaction. Or is it the other way around: interaction leads to friendship which leads to similarity?
5. How much do prior relationships affect the group dynamics?
Devote a paragraph for each person in the team, including yourself, to describe what they are like, particularly in relation to the kind of informal role they play in the group. By informal role, I mean things like this:
| Copyright ©1996 Stephen P. Borgatti | Revised: September 28, 2001 | Go to Home page |