These are notes on "The Medieval River Trade Network of Russia Revisited" by Forrest Pitts. Published in Social Networks (1978/79) 1:285-292
Here is a map of Russia in the 12th and 13th centuries:
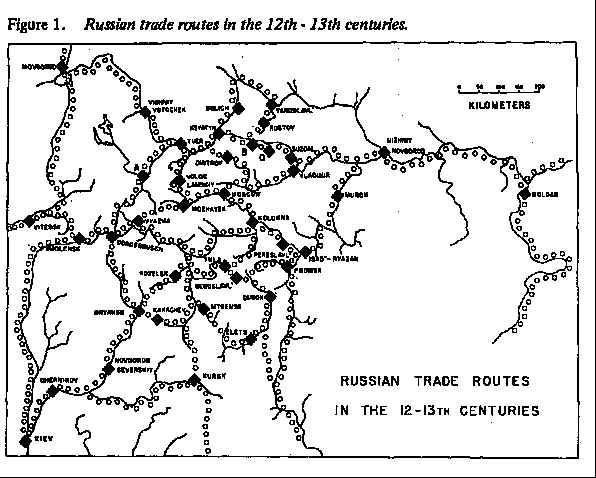
Figure 1. Russian trade routes in the 12th-13th centuries.
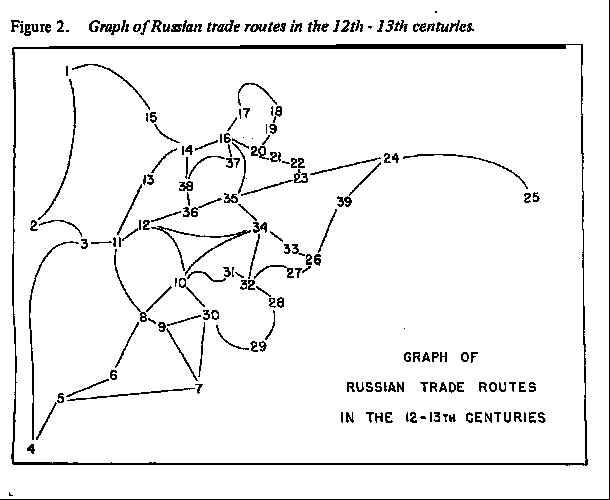
Figure 2. Graph of Russian trade routes in the 12th-13th centuries. Moscow is #35
Many historians have written about Moscow's gradual rise to a position of dominance over other towns. Most claim that the growth was a response to favorable geographical conditions. The Russian historian Kluchevsky (1911) comments:
"The political fortunes of Moscow were closely connected with its geographical position." (p.273)
"Thus Moscow arose at the point of intersection of three great land roads - a geographical position which conferred important economic advantages upon the city and its neighborhood. ...Boyars always followed the currents of popular migration, so that their genealogical records are evidence that at that period [time of Daniel, youngest son of Alexander Nevsky, circa 1270 AD.] the general trend was toward Moscow. This steady influx into the city, as into a central reservoir, of all the Russian popular forces threatened by external foes was primarily due to the geographical position of Moscow." (p.276)
"Immunity from attack, so rare in those days [circa 1240 - I 360], caused the eastward movement of Russian colonization to become reversed. That is to say, settlers began to flow back from the old-established colonies of Rostov to the unoccupied lands of the Principality of Moscow. This constituted the first condition which, arising out of the geographical position of Moscow, contributed to the successful settlement of the Moscovite region Another condition which... contributed to the growth of the Principality was the fact that Moscow stood upon a river which had always - even from the most ancient times - been possessed of great commercial. importance ... a waterway connecting the system of the Middle Oka with the system of the Upper Volga. ...By thus making Moscow the point where two great popular movements intersected one another - namely, a movement of colonization northeastwards and a movement of commerce southwestwards, the city's geographical position conferred great economic advantages upon the Moscovite Prince. A large population attracted to his appanage meant a large number of direct taxpayers, while the movement of a large volume of commercial traffic on the Moskva meant a stimulation of popular industry in his dominions and a large flow of transit-dues into his treasury." (p. 278)
The American historian Blum (1961) added:
"The success of the Muscovite house seems best to be explained by a combination of the favorable geographical location of Moscow and lots of good luck. Their capital lay at the intersection of important overland routes, while the Moscow River, on whose banks the city rose, connected the two chief river systems of European Russia." (p.67) "Merchants came there from all parts of Russia and from abroad to buy and sell, and foreign visitors from the latter fifteenth century on were impressed by the amount of business activity they observed. From Moscow merchandise was shipped in every direction, sometimes traveling hundreds of miles before reaching its destination." (p:125)
In this paper the physical network of rivers is first of all a transportation network. The medieval Russians traveled the rivers by boats in summer and with sleds over the river ice in winter. But the river network supported social interaction. Trading of slaves, amber, honey and furs produced economic networks. Marriage alliances and religious exchanges both produced and strengthened social networks. And the frequent interaction permitted the Russian language to spread and become dominant over a wide area.
By way of reprise, the results reported by Pitts (1965) are summarized in Table 1. The connection array results arose from the powering of an adjacency matrix (in which entries are 1 if two places are adjacent on the river net, 0 otherwise). In this view Moscow ranks fifth among the 39 places. The short-path array was calculated by determining the minimum number of intermediate links between each pair of places. Its results show Kolomna as the best connected place, with Moscow ranking second.
Table 1
| Connection Array | Short-Path | |||
|---|---|---|---|---|
| Actual | Percentage | Place | Actual | Rank |
| 2652 | 0.51 | Novgorod | 176 | 35 |
| 3574 | 0.68 | Vitebsk | 172 | 32 |
| 9521 | 1.82 | Smolensk | 148 | 17.50 |
| 5303 | 1.01 | Kiev | 173 | 33 |
| 8691 | 1.66 | Chernikov | 181 | 36 |
| 10181 | 1.95 | Novgorod Severskiy | 162 | 28 |
| 14703 | 2.81 | Kursk | 160 | 26 |
| 26898 | 5.15 | Bryansk | 130 | 9 |
| 18662 | 3.57 | Karachev | 157 | 22.50 |
| 41022 | 7.85 | Kozclsk | 116 | 4 |
| 24001 | 4.59 | Dorogobusch | 121 | 7 |
| 36292 | 6.94 | Vyarma | 113 | 3 |
| 11282 | 2.16 | "A" | 132 | 11 |
| 14843 | 2.84 | Tver | 128 | 8 |
| 5184 | 0.99 | Vishniy Totochck | 158 | 24 |
| 19451 | 3.72 | Ksyatyn | 118 | 5.50 |
| 6883 | 1.32 | Uglich | 152 | 20 |
| 3114 | 0.60 | Yaroslavi' | 184 | 38 |
| 3415 | 0.65 | Rostov | 182 | 37 |
| 8150 | 1.56 | "B" | 148 | 17.50 |
| 3711 | 0.71 | "C" | 174 | 34 |
| 4249 | 0.81 | Suzdal | 163 | 29 |
| 10344 | 1.98 | Vladimir | 133 | 12 |
| 4518 | 0.86 | Nizhniy Novgorod | 161 | 27 |
| 1394 | 0.27 | Bolgar (Kazan) | 198 | 39 |
| 7101 | 1.36 | Isad'-Ryazan | 156 | 21 |
| 8135 | 1.56 | Pronsk | 159 | 25 |
| 8671 | 1.66 | Dubok | 157 | 22.50 |
| 9248 | 1.77 | Elets | 170 | 30 |
| 23936 | 4.58 | M tsensk | 141 | 15 |
| 17717 | 3.39 | Tula | 145 | 16 |
| 21015 | 4.02 | Dedoslavi' | 131 | 10 |
| 13414 | 2.57 | Pereslavi' | 134 | 13 |
| 39478 | 7.55 | Kolomna | 104 | 1 |
| 26663 | 5.10 | Moscow | 107 | 2 |
| 22016 | 4.21 | Mozhaysk | 118 | 5.50 |
| 9954 | 1.90 | Dmitrov | 151 | 19 |
| 13681 | 2.62 | Volok Lamskiy | 138 | 14 |
| 3515 | 0.67 | Murom | 171 | 31 |
Rather, I prefer to regard the sum of all short-path Euclidean distances for a place (node) as a measure of accessibility, in the sense that it represents the effort to go between that node and all other nodes via the shortest paths. When divided by the sum of all short paths in the system, it becomes a percentage of effort within the system of places.
When one counts the number of times a short path between two places passes through an intermediate node, one obtains what Shimbel (1953:507) calls stress. At the conclusion to his paper, Shimbel wrote:
"If we count all of the minimum paths which pass through site k, then we have a measure of the "stress" which site k must undergo during the activity of the network. A vector giving this number for each number [i.e., site] of the network would give us a good idea of stress conditions throughout the system."
Shimbel concluded his 1953 article by saying: "This 'stress' vector can derived directly from the structure matrix but unfortunately the process is not simple" (p.507). The algorithm for the derivation of the short-path node listing was later described by Dantzig (1960), and programmed by Scott (1967) in the middle 1960s.
Shimbel's stress idea was generalized by Freeman (1977) as a betweenness index. If a node falls on the only minimum path or on all the minimum paths linking a pair of other nodes it is tabulated twice in Shimbel's index and once in Freeman's. On the other hand, a point that falls on one of several shortest paths linking a particular pair of others is not tabulated in the stress index but is weighted in proportion to its occurrence in the betweenness index. Of course if there is only one minimum path connecting each pair of points the stress measure is exactly twice the betweenness measure. Under this condition Scott's (1967) Minpath program calculates both stress and betweenness times two.
However, when there are several minimum paths connecting any pair of nodes, Scott's program does not calculate stress. If there are no more than two minimum paths connecting any pair of points, Scott's index is still equal to the betweenness index times two. But if more than two minimum paths exist anywhere in the network, the Scott algorithm does not calculate either stress or betweenness it does not even generate a unique solution.
In the present application there were never more than two minimum paths linking any pair of nodes, so Scott's intermediate node occurrence rate was used along with his aggregate distance of each short path. These two sets of results are presented in Table 2.
Although stress or betweenness measures one aspect of a network of communication, the system effort required in moving from one place to all other places by the shortest paths between them is in a sense a reciprocal measure. System effort, however, is not determined by betweenness in theory. The relation between these measures for the Russian river network is shown in Figure 3. There it is obvious that the intermediate node occurrence rate has a greater variance, and is a more discriminating measure of node centrality. The percentage of system effort is, on the other hand, a good measure of node accessibility
Table 2. Intermediate node occurrence rates and
short-path distances for the Russian rivernet
| Place | INOR | Aggregate short-path distances |
Percent INOR |
Percentage of agg. short-path distances |
|
|---|---|---|---|---|---|
| 1 | Novgorod | 0 | 7179 | 0.00 | 4.11 |
| 2 | Vitebsk | 11 | 5647 | 0.22 | 3.23 |
| 3 | Smolensk | 119 | 4247 | 2.39 | 2.43 |
| 4 | Kiev | 0 | 7704 | 0.00 | 4.41 |
| 5 | Chernikov | 30 | 6244 | 0.60 | 3.57 |
| 6 | Novgorod Severskiy | 96 | 5052 | 1.93 | 2.89 |
| 7 | Kursk | 0 | 5768 | 0.00 | 3.30 |
| 8 | Bryansk | 288 | 4062 | 5.80 | 2.32 |
| 9 | Karachev | 86 | 4240 | 1.73 | 2.42 |
| 10 | Kozclsk | 163 | 3753 | 3.28 | 2.15 |
| 11 | Dorogobusch | 377 | 3596 | 759 | 2.06 |
| 12 | Vyarma | 268 | 3411 | 5.39 | 1.95 |
| 13 | "A" | 101 | 4077 | 2.03 | 2.33 |
| 14 | Tver | 228 | 3745 | 4.59 | 2.14 |
| 15 | Vishniy Totochck | 61 | 4795 | 1.23 | 2.74 |
| 16 | Ksyatyn | 410 | 3788 | 8.25 | 2.17 |
| 17 | Uglich | 0 | 4395 | 0.00 | 2.51 |
| 18 | Yaroslavi' | 2 | 5047 | 0.04 | 2.89 |
| 19 | Rostov | 72 | 4697 | 1.45 | 2.69 |
| 20 | "B" | 231 | 4208 | 4.65 | 2.41 |
| 21 | "C" | 74 | 4242 | 1.49 | 2.43 |
| 22 | Suzdal | 73 | 4056 | 1.47 | 2.32 |
| 23 | Vladimir | 186 | 3939 | 3.74 | 2.25 |
| 24 | Nizhniy Novgorod | 93 | 5216 | 1.87 | 2.98 |
| 25 | Bolgar (Kazan) | 0 | 8640 | 0.00 | 4.93 |
| 26 | Isad'-Ryazan | 119 | 3742 | 2.39 | 2.14 |
| 27 | Pronsk | 64 | 3846 | 1.29 | 2.20 |
| 28 | Dubok | 48 | 4091 | 0.97 | 2.34 |
| 29 | Elets | 6 | 4500 | 0.12 | 2.57 |
| 30 | Mtsensk | 44 | 4520 | 0.89 | 2.59 |
| 31 | Tula | 90 | 3517 | 1.81 | 2.01 |
| 32 | Dedoslavi | 205 | 3468 | 4.13 | 1.98 |
| 33 | Pereslavi | 107 | 3498 | 2.15 | 2.00 |
| 34 | Kolomna | 339 | 3009 | 6.82 | 1.72 |
| 35 | Moscow | 531 | 2876 | 10.69 | 1.64 |
| 36 | Mozhaysk | 321 | 3108 | 6.46 | 1.78 |
| 37 | Dmitrov | 24 | 4071 | 0.48 | 2.33 |
| 38 | Volok Lamskiy | 74 | 3683 | 1.49 | 2.11 |
| 39 | Murom | 28 | 5194 | 0.56 | 2.97 |
| TOTAL: | 4969 | 174851 |
With regard to the growth of Moscow, we may say that it has a structural or topological advantage in having the highest betweenness index in the system as well as the lowest proportion of system effort devoted to river travel. I would assume that a structural advantage of this sort would become a social and economic advantage. Whether this actually occurred is for historians to debate, but their considerations must now take into account the results reported here.
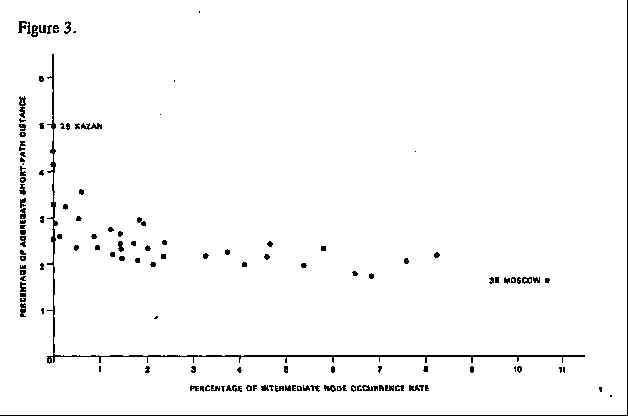
Figure 3.