Suppose you obtain the following table that relates # of drownings per day to amount of icecream eaten per day (the sample size is 200 days randomly chosen from a given year) :
| Drownings | ||||
| Few | Many | Sampled | ||
| IceCream eaten |
Little | 60 | 40 | 100 |
| Lots | 40 | 60 | 100 | |
| Sampled | 100 | 100 | 200 | |
chi-square = 8, df = 1, p < 0.005
| Drownings | |||||
| Few | Many | Sampled | Prop | ||
| IceCream eaten |
Little | 60 | 40 | 100 | .50 |
| Lots | 40 | 60 | 100 | .50 | |
| Sampled | 100 | 100 | 200 | ||
| Prop. | .50 | .50 | 1.00 | ||
Calculating Expected Frequencies
(given assumption of independence)
| Few | Many | Sampled | |
| Little | .5*.5*200 = 50 | .5*.5*200 = 50 | 100 |
| Lots | .5*.5*200 = 50 | .5*.5*200 = 50 | 100 |
| Sampled | 100 | 100 | 200 |
Differences
| Drownings | ||||
| Few | Many | Sampled | ||
| IceCream eaten |
Little | 10 | -10 | 0 |
| Lots | -10 | 10 | 0 | |
| Sampled | 0 | 0 | 0 | |
| Drownings | ||||
| Few | Many | Sampled | ||
| IceCream eaten |
Little | 100 | 100 | 200 |
| Lots | 100 | 100 | 200 | |
| Sampled | 200 | 200 | 400 | |
Squared differences divided by expected
| Drownings | ||||
| Few | Many | Sampled | ||
| IceCream eaten |
Little | 2 | 2 | 4 |
| Lots | 2 | 2 | 4 | |
| Sampled | 4 | 4 | 8 | |
So the chi-square value is 8, the degrees of freedom = 1, and, if we look this up in the chi-square table, we find that the p-value (the significance) is < 0.05 (it is significant).
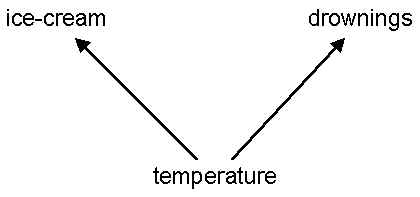
So ice-cream sales are related to drownings. The question is 'why?'. Your theory is that the reason why the amount of ice-cream is related to the number of drownings is because of a third variable, which is the temperature of the day. On hot days, people buy more ice-cream, and they also go swimming, which results in some drowings. Like this:
To test this theory, what you need to do is to control for temperature. According to the theory, if you consider only hot days, there should be no relationship between ice-cream and drownings. Similarly, if you consider only cold days, there should again be no relationship between ice-cream and drownings. The reason is that the only connection, theoretically, between ice-cream and drownings is through temperature.
So what you do is create two separate tables that relate ice-cream to drownings: one for hot days, and one for cold:
HOT DAYS |
Drownings | |||
| Few | Many | Sampled | ||
| IceCream eaten |
Little | 50 | 20 | 70 |
| Lots | 20 | 10 | 30 | |
| Sampled | 70 | 30 | 100 | |
Chi-Square = 0.227; DF = 1; P = 0.6
COLD DAYS |
Drownings | |||
| Few | Many | Sampled | ||
| IceCream eaten |
Little | 10 | 20 | 30 |
| Lots | 20 | 50 | 70 | |
| Sampled | 30 | 70 | 100 | |
Chi-Square = 0.227; DF = 1; P = 0.6
Notice that if you add the corresponding cells of the two tables, you obtain the original table for all days. Notice also that for each table, the chi-square test is non-significant. This supports your theory: when you control for temperature, the apparent relationship between ice-cream and drownings disappears. The only the reason you thought there was a relationship at all is because you were mixing together both hot and cold days.
To further test your theory, you also have to check each individual link in the model. For example, the theory says that temperature determines ice-cream sales. So that implies that a chi-square test of the relationship between temperature and sales will be significant. The theory also says that temperature determines drownings, so you need to check that those two variables are significantly associated as well.
So let me summarize. If the theory has either of the following forms,
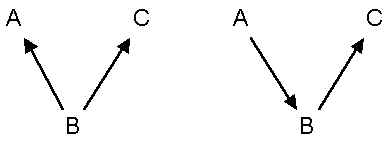
then to test it you do the following steps: