Suppose you take a random sample of BC students and ask one question: "Have you ever -- accidentally or on purpose -- set your dorm room on fire?". And 10 students say "yes". Is this a lot or a little? It is impossible to tell unless you know how many said "no", or, equivalently, how many students there were in the sample as a whole. If the sample contained only 20 students, that means that 50% of those sampled had set their rooms on fire, which seems like a lot. But if the sample contained 1000 students, then 10/1000 = one out of 100 or 1%, which doesn't seem so bad.
The point is that when counting the number of people choosing a given response on a questionnaire, it is important to report percentages as well as frequencies. For example, here is a frequency table generated by SPSS using their sample dataset called "Employee Data" (which should be available on any machine that has SPSS so you can duplicate my tables):
Minority classification |
|||||
Frequency |
Percent |
Valid Percent |
Cumulative Percent |
||
Valid |
No |
370 |
78.06 |
78.06 |
78.06 |
Yes |
104 |
21.94 |
21.94 |
100.00 |
|
Total |
474 |
100.00 |
100.00 |
||
Total |
474 |
100.00 |
|||
In this study, 474 employees were surveyed, and 104 of these ( (about 22%) identified themselves as minorities. Similarly, here is the table for "Job Classification":
Employment category |
|||||
Frequency |
Percent |
Valid Percent |
Cumulative Percent |
||
Valid |
Clerical |
363 |
76.58 |
76.58 |
76.58 |
Custodial |
27 |
5.70 |
5.70 |
82.28 |
|
Manager |
84 |
17.72 |
17.72 |
100.00 |
|
Total |
474 |
100.00 |
100.00 |
||
Total |
474 |
100.00 |
|||
Apparently, in this company you are either a manager, or a member of the clerical or custodial staff! (This is a very strange and probably useless way of classifying employees!)
As we have discussed earlier, sampling is a great thing. But there is always the possibility that the percentages you obtain in a sample differ from the percentages in the population. For example, suppose an organization has 100,000 employees. We want to determine what percentage of the employees would consider themselves minorities. But rather than survey all 100,000, we take a sample of 474. The results are that 21.94% of the sample consider themselves minorities. Now, does that mean that exactly 21.94% of ALL employees in the company consider themselves a minority? That would be exactly 21,940 persons.
Since the 21.94% came from a random sample of 474, it is quite possible that the proportion in the company as a whole is not exactly 21.94%. It could be 23%. Or 19%. It could even be really different from 21.94%, like 10% or 30%. It all depends on who happened to be chosen in the sample. Since it was random, by chance alone we might have gotten a whole lot of minorities (in fact, the whole sample could have been only minorities), or very few (in fact, no minorities).
This is no different from flipping a coin. We all know that when we flip a coin the chance of getting "heads" is 50%. So if we flip a coin four times, we expect to get 2 heads and 2 tails. But it doesn't have to come out that way, right? I'm going to flip a coin four times right now .... Here's how it turned out:
T H H T
Ok, so this time it worked: one tail, followed by two heads, followed by one tail. Let me try it again ....
H T H H
This time I got 3 heads and just one tail. Whenever you flip exactly 4 coins in a row, there are only these possible results:
| Sequence | Number of Heads |
|---|---|
| H H H H | 4 |
| H H H T | 3 |
| H H T H | 3 |
| H H T T | 2 |
| H T H H | 3 |
| H T H T | 2 |
| H T T H | 2 |
| H T T T | 1 |
| T H H H | 3 |
| T H H T | 2 |
| T H T H | 2 |
| T H T T | 1 |
| T T H H | 2 |
| T T H T | 1 |
| T T T H | 1 |
| T T T T | 0 |
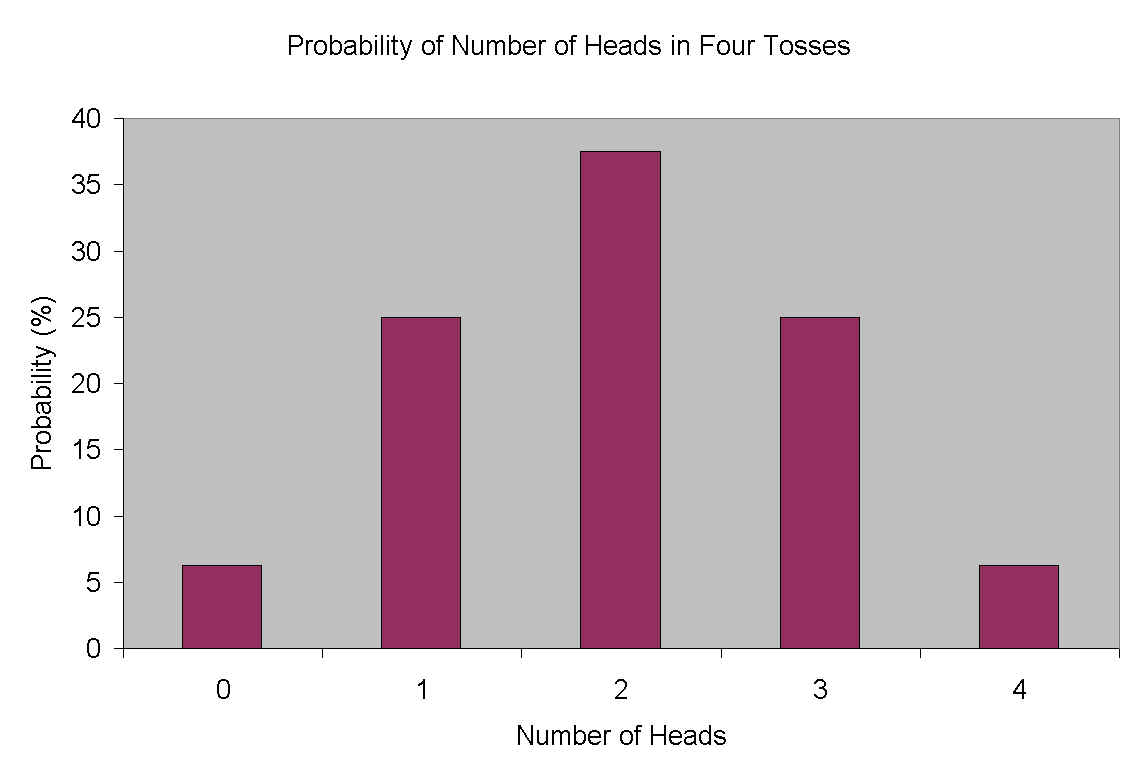
Each of these sequences is equally likely. That means that getting zero heads is fairly unlikely: it would only occur 1/16th of the time (6.25%). Similarly, getting all heads is equally unlikely: it would occur, on average, 6.25% of the time. Here are the probabilities of each type of outcome:
| Outcome | Probability |
| 4 heads | 6.25% |
| 3 heads | 25.00% |
| 2 heads | 37.50% |
| 1 head | 25.00% |
| 0 heads | 6.26% |
Notice that getting 2 heads is in fact the most likely result (37.5%) of flipping 4 coins. But it doesn't have to come out that way: in fact, most of the time (62.50%) it comes out some other way.
Notice also that the likelihood of getting some number of heads other than 2 varies with the difference from 2. In other words, if it doesn't come out 2 heads, then it probably comes out 1 or 3 heads. The least likely are the alternatives that are most different from 2, namely 4 heads and 0 heads.
In the case of the coins, 37.5% of the time you get 2 heads exactly. 87.5% of the time you get 2 heads plus or minus 1 head. And 100% of the time you get 2 heads plus or minus 2 heads.
In the case of the minorities in the organization, the question is, how far off is my sample likely to be? We would like to be able to say something like this:
In other words, it is not enough to give a single estimate: we need to say something about how far off the estimate is likely to be.
It turns out that the confidence we can have that the population value will be within X percentage points of the value in the sample is a function of something called the standard error, which in turn is related to the standard deviation of the MINORITY variable. Frankly, all of this will make more sense when we consider confidence intervals for means, rather than for percentages like we are doing now. So let's skip the theory for now and just get to how to do it.
In order to be 95% confident that the population value is within X points of the sample value, we need to compute
X = 1.96*SE
where SE (standard error) is computed like this:
SE = Sqrt (p*(100-p)/n)
where "p" is the sample percentage, "*" means multiply, and n is the sample size. So in our case, p = 22% (I'm rounding off to make it simpler), and n = 474. So
SE = Sqrt(22*78/474) = Sqrt(3.62) = 1.9
X = 1.96*1.9 = 3.7
So, if 22% of our sample consider themselves minorities, we can be 95% confident that the percentage of all employees in the company that consider themselves a minority is between 22-3.7 and 22+3.7. That is,
| 18.3% < | true value |
< 25.7% |
When the population that you are sampling from is not huge, we can make a small correction in the formulas above to make the confidence intervals slightly more accurate. Basically, you need to multiply the SE by:
Sqrt((N-n)/(N-1))
where n is the size of the sample, and N is the size of the population. In our case, the N is the size of the organization as a whole (100,000) and n is the size of the sample (474). So in our case, we would multiply the SE (which we calculated as 1.9) by
Sqrt(99526/99,999) = Sqrt(0.99527) = 0.9976
So we would multiply 1.9 by 0.9976, which gives 1.8955. Obviously, this is so similar to 1.9 that it is hardly worth it. That's because the organization (the population) was so large. But if we had sampled 474 from an organization that was only 2,000 employees in total, the correction would have been important:
Sqrt(1526/1999) = Sqrt(0.76338) = 0.8737
If we multiply 1.9 by this new correction factor of 0.8737, we get 1.66. That's enough to make a real difference in our confidence intervals. Multiplying 1.66 by 1.96 gives approximately 3.25, so our new 95% confidence interval would be:
| 18.75% < | true value |
< 25.25% |
Still, the difference is not enormous, which is why this calculation is thought of as a detail.