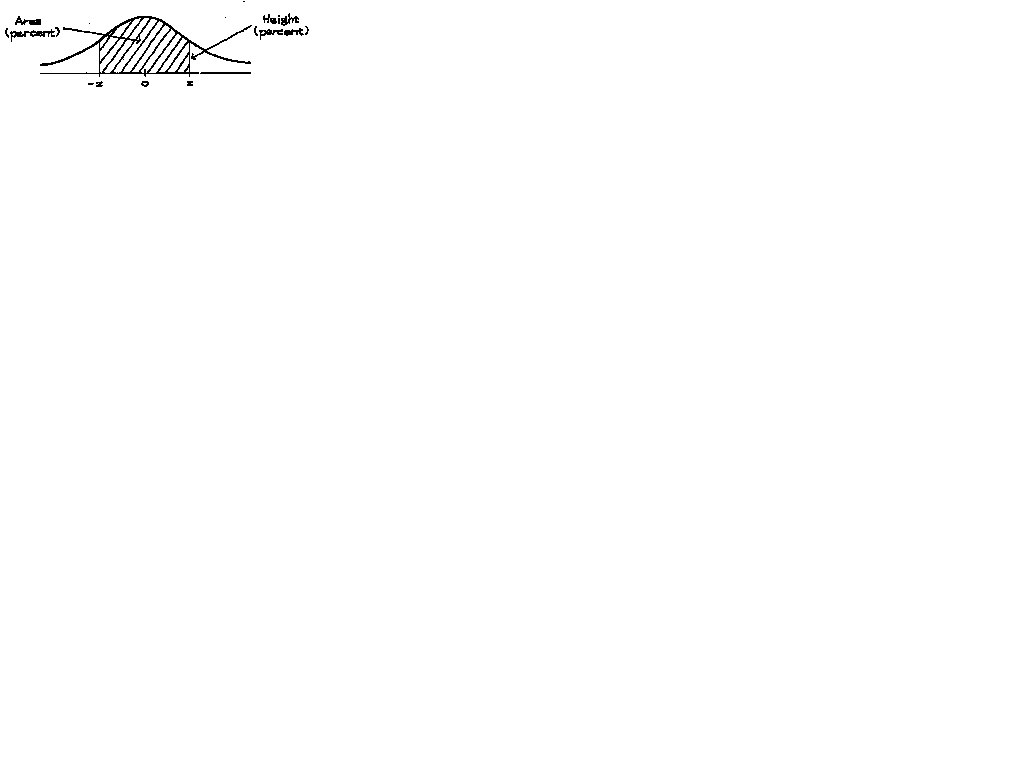
For example, given a t or z statistic of 2.05, you look down the left hand column until you get to 2.05. Then you look over on the right hand column to get the percentage (which is 95.96). Then you subtract that from 100 to get the p-value (expressed as a percentage), which is 4.04% or 0.0404 expressed as a proportion. Which is significant since it is less than our conventional cutoff of 0.05.
Here's another one. Given a t-statistic of 1.5, what is the p-value? Well, in the table 1.5 gives a percentage of 86.64, so the p-value 13.36% which is 0.1336. Which is NOT significant.
| Z score | Percent |
|---|---|
| 0 | 0 |
| 0.05 | 3.99 |
| 0.1 | 7.97 |
| 0.15 | 11.92 |
| 0.2 | 15.85 |
| 0.25 | 19.74 |
| 0.3 | 23.58 |
| 0.35 | 27.37 |
| 0.4 | 31.08 |
| 0.45 | 34.73 |
| 0.5 | 38.29 |
| 0.55 | 41.77 |
| 0.6 | 45.15 |
| 0.65 | 48.43 |
| 0.7 | 51.61 |
| 0.75 | 54.67 |
| 0.8 | 57.63 |
| 0.85 | 60.47 |
| 0.9 | 63.19 |
| 0.95 | 65.79 |
| 1 | 68.27 |
| 1.05 | 70.63 |
| 1.1 | 72.87 |
| 1.15 | 74.99 |
| 1.2 | 76.99 |
| 1.25 | 78.87 |
| 1.3 | 80.64 |
| 1.35 | 82.3 |
| 1.4 | 83.85 |
| 1.45 | 85.29 |
| 1.5 | 86.64 |
| 1.55 | 87.89 |
| 1.6 | 89.04 |
| 1.65 | 90.11 |
| 1.7 | 91.09 |
| 1.75 | 91.99 |
| 1.8 | 92.81 |
| 1.85 | 93.57 |
| 1.9 | 94.26 |
| 1.95 | 94.88 |
| 2 | 95.45 |
| 2.05 | 95.96 |
| 2.1 | 96.43 |
| 2.15 | 96.84 |
| 2.2 | 97.22 |
| 2.25 | 97.56 |
| 2.3 | 97.86 |
| 2.35 | 98.12 |
| 2.4 | 98.36 |
| 2.45 | 98.57 |
| 2.5 | 98.76 |
| 2.55 | 98.92 |
| 2.6 | 99.07 |
| 2.65 | 99.2 |
| 2.7 | 99.31 |
| 2.75 | 99.4 |
| 2.8 | 99.49 |
| 2.85 | 99.56 |
| 2.9 | 99.63 |
| 2.95 | 99.68 |
| 3 | 99.73 |
| 3.05 | 99.771 |
| 3.1 | 99.806 |
| 3.15 | 99.837 |
| 3.2 | 99.863 |
| 3.25 | 99.885 |
| 3.3 | 99.903 |
| 3.35 | 99.919 |
| 3.4 | 99.933 |
| 3.45 | 99.944 |
| 3.5 | 99.953 |
| 3.55 | 99.961 |
| 3.6 | 99.968 |
| 3.65 | 99.974 |
| 3.7 | 99.978 |
| 3.75 | 99.982 |
| 3.8 | 99.986 |
| 3.85 | 99.988 |
| 3.9 | 99.99 |
| 3.95 | 99.992 |
| 4 | 99.9937 |
| 4.05 | 99.9949 |
| 4.1 | 99.9959 |
| 4.15 | 99.9967 |
| 4.2 | 99.9973 |
| 4.25 | 99.9979 |
| 4.3 | 99.9983 |
| 4.35 | 99.9986 |
| 4.4 | 99.9989 |
| 4.45 | 99.9991 |