When you start up SPSS, the first thing you see is the spreadsheet. It looks like this:
You use the spreadsheet to enter your data. (You can also use Excel, and then cut and paste that spreadsheet into this one. Either way.)
On the IBM, you right-click on buttons labeled "var" to give the variable a name. (I don't know what you do on a MAC since there is only one button.) The variables I'm using in this example are:
After entering the data, your screen should like something like this:
Note the "." in two cells of row 8. These are missing values (the respondent didn't answer those two questions).
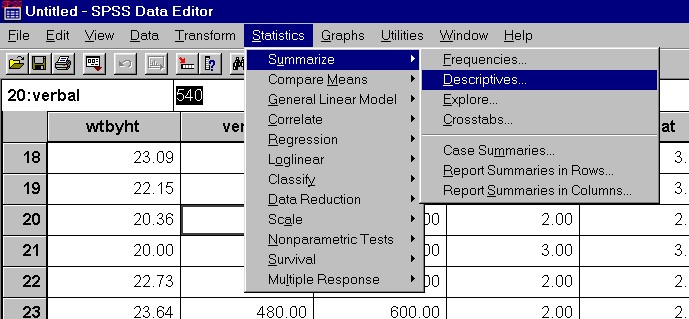
Now suppose I want to calculate the means and standard deviations of the variables. I go to "Statistics" in the menu, then choose "Summarize", then choose "Descriptives" as follows:
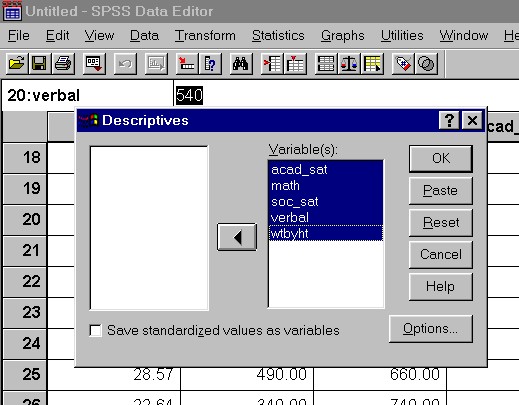
This brings up a dialog box which lists all your variables on the left side. You highlight the ones you want, then press the button in the middle of the screen to move the variables over to the right side:
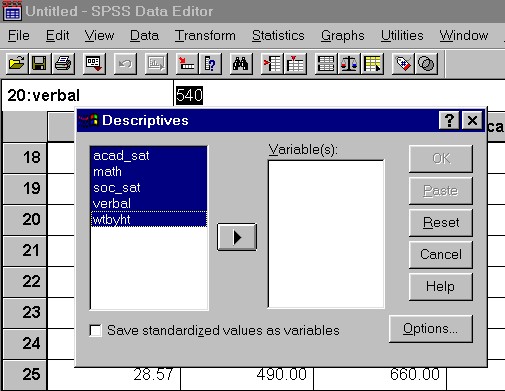
Then press OK to run the program:
The result is the following table:
| N | Minimum | Maximum | Mean | Std. Deviation | |
| ACAD_SAT | 33 | 1.00 | 3.00 | 2.3030 | .5294 |
| MATH | 32 | 450.00 | 740.00 | 596.8750 | 64.9783 |
| SOC_SAT | 33 | 2.00 | 3.00 | 2.5455 | .5056 |
| VERBAL | 32 | 340.00 | 630.00 | 526.8750 | 66.2565 |
| WTBYHT | 33 | 20.00 | 30.00 | 24.1983 | 2.9420 |
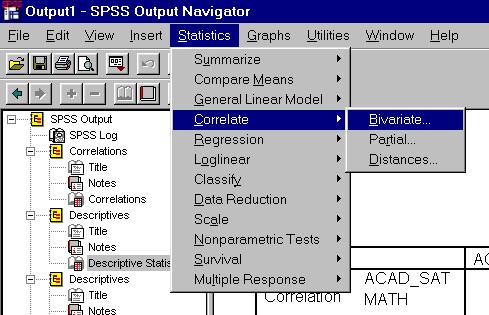
Now suppose I want to look at correlations among all of these variables. Choose "Statistics" from the menu, then choose "Correlate" as follows:
This brings up a dialog box similar to the one for means and standard deviations. Your variables appear on the left, and you highlight and move to the right all the ones that you want correlated. The result is this:
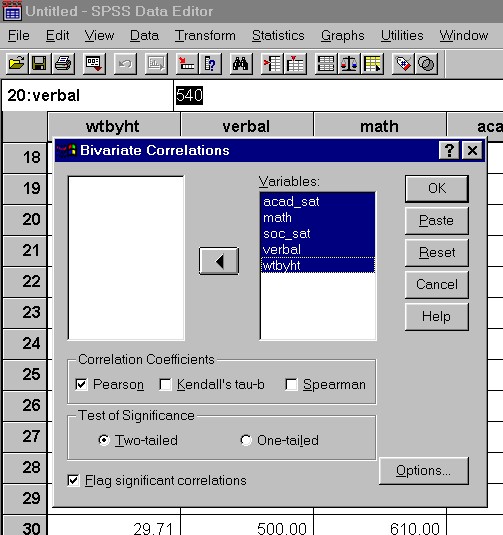
Make sure that "Pearson" and "two-tailed" are checked-off. The press OK. The result should be the following tables:
| ACAD_SAT | MATH | SOC_SAT | VERBAL | WTBYHT | |
| ACAD_SAT | 1.000 | -.078 | .180 | **.483 | -.184 |
| MATH | -.078 | 1.000 | *.371 | -.292 | *.351 |
| SOC_SAT | .180 | *.371 | 1.000 | .132 | -.114 |
| VERBAL | **.483 | -.292 | .132 | 1.000 | -.308 |
| WTBYHT | -.184 | *.351 | -.114 | -.308 | 1.000 |
** Correlation is significant at the 0.01 level (2-tailed).
* Correlation is significant at the 0.05 level (2-tailed).
| ACAD_SAT | MATH | SOC_SAT | VERBAL | WTBYHT | |
| ACAD_SAT | . | .672 | .315 | .005 | .306 |
| MATH | .672 | . | .037 | .105 | .049 |
| SOC_SAT | .315 | .037 | . | .473 | .528 |
| ERBAL | .005 | .105 | .473 | . | .087 |
| WTBYHT | .306 | .049 | .528 | .087 | . |
The first table gives the amount of correlation between each pair of variables, and the second table gives the significance of the correlation (essentially, the probability of obtaining such a correlation in the sample even if the in the population the correlation is zero). As you can see there are three correlations that are significant:
In other words, it looks like people with good verbal skills do well in college, people with good math skills are happy with their social lives, and people who are relatively heavy are good in math.
Now suppose I want to run a regression using wtbyht, verbal and math as my independent variables, and acad_sat as my dependent variable. I already know that verbal SAT score correlates with academic satisfaction, but I'd like to control for the effects of relative weight and math SAT score. The way to to do that is to include all those variables as independent variables in a regression to predict academic satisfaction.
I go to "Statistics" in the menu, then choose "regression" and then "linear", as follows:
That brings up a dialogue box in which all the variables are listed on the left, and you have to highlight each one and copy it to the appropriate area on the right, putting acad_sat in the area for the dependent variable, and putting math, verbal and wtbyht in the area for the independent variables, as shown below:
Then you press "OK" and the program runs the regression. Here are the results:
| Model Summary | ||||||
| Variables | R | R Square | Adjusted R Square | Std. Error of the Estimate | ||
|---|---|---|---|---|---|---|
| Model | Entered | Removed | ||||
| WTBYHT, VERBAL, MATH | . | 0.50996 | 0.260059 | 0.174681 | 0.473159 | |
| ANOVA | ||||||
| Model | Sum of Squares | df | Mean Square | F | Sig. | |
|---|---|---|---|---|---|---|
| 1 | Regression | 2.045797 | 3 | 0.681932 | 3.045978 | 0.046526 |
| Residual | 5.82087 | 26 | 0.22388 | |||
| Total | 7.866667 | 29 |
| Coefficients | ||||||
| Unstandardized Coefficients | Standardized Coefficients | t | Sig. | |||
|---|---|---|---|---|---|---|
| Model | B | Std. Error | Beta | |||
| 1 | (Constant) | 0.269004 | 1.418081 | 0.189696 | 0.851021 | |
| MATH | 0.000956 | 0.001514 | 0.116834 | 0.631529 | 0.533208 | |
| VERBAL | 0.003697 | 0.001382 | 0.483749 | 2.675802 | 0.012729 | |
| WTBYHT | -0.02159 | 0.032136 | -0.12602 | -0.67193 | 0.507558 | |
The first table gives you the r-square of the regression, which is 0.26, and the adjusted r-square, which is 0.17. These values are modest, but respectable.
The second table gives the p-value for the regression as a whole, which is 0.05 (actually, 0.046526). This suggests that the independent variables really are related to the dependent variable in the population. Or at least some of them are.
The third table gives the regression coefficients for each independent variable. The most important column is the last one, which gives the p-value for each variable. As you can quickly see, only one of the variables (verbal) actually has anything to do with predicting satisfaction with academic performance. The p-value is significant (i.e., less than 0.05). This means that verbal SAT score predicts satisfaction with academic performance even if you control for the other two variables. The p-value of all the other variables is non-significant, indicating that they are not useful in predicting acad_sat.
The column labeled "B" under "unstandardized coefficients" tells you how much the dependent variable goes up, on average, given that the independent variable goes up one unit. So for VERBAL, the coefficient 0.003697 means that an increase of one point on the verbal SAT score corresponds to an increase of 0.003697 points of satisfaction with academic performance. Don't let the small size of that number fool you: acad_sat was measured on a scale of 1 to 3. VERBAL is measured on a very different scale: 200 to 800. If we had measured ACAD_SAT on a 1000 to 3000 scale, the coefficient would have been 3.697. The coefficient says that if we compare people who scores around 600 on the SAT with people who scores around 300, the first group scores an average of more than a full point higher in satisfaction (300 times 0.003697 is about 1.1).
The column labeled "BETA" under "standardized coefficents" tells you how many standard deviations the dependent variable goes up given that the independent variable has gone up one standard deviation. By rescaling the coefficients in terms of standard deviations, we eliminate the issue of the scale of the variables, which means that all the coefficients are comparable to each other. You can see that the standardized coefficient for VERBAL is 0.48, which is quite a bit bigger than the corresponding coefficients for the other variables. VERBAL really does affect (satisfaction with) academic performance, whereas score on the math SAT really doesn't, at least for the kind of people that take this class. Similarly one's weight divided by height is unrelated to one's satisfaction with one's academic performance.
By the way, when I re-ran the regression using satisfaction with social life (SOC_SAT) as the dependent variable, I got the opposite results:
| Coefficients | ||||||
| Unstandardized Coefficients | Standardized Coefficients | t | Sig. | |||
|---|---|---|---|---|---|---|
| Model | B | Std. Error | Beta | |||
| 1 | (Constant) | 0.514016 | 1.397152 | 0.367903 | 0.715924 | |
| MATH | 0.003983 | 0.001492 | 0.49941 | 2.669356 | 0.012921 | |
| VERBAL | 0.001491 | 0.001361 | 0.200218 | 1.095122 | 0.283505 | |
| WTBYHT | -0.04674 | 0.031662 | -0.28002 | -1.47634 | 0.151862 | |
| a | Dependent Variable: SOC_SAT | |||||
Now, only MATH is significant. And the coefficient is positive, which means that the better you do in the math SAT, the happier you are with your social life. That's pretty interesting. Any theories?