The basic idea is to identify (a) the elements (variables) of a conceptual system, and (b) how these elements are interrelated. In particular, we are interested in causal relationships (but many other relationships are important as well). For data, we can use interviews, text, inferences from behavior, etc. In class, we used a section of a journal article. The modeling unit is usually an individual, but it can also be a group.
The main output is a map of which variables are seen to influence which other variables. This is then analyzed various ways, depending on the research questions (see below). Before analyzing the maps, however, it is often useful to apply some data reduction techniques.
Figure 1. Causal network.
Combining structurally identical nodes. Consider the map in Figure 1. Notices that nodes A and B are caused by the exact same causes, and in turn cause the exact same things. Although A and B may be clearly different constructs, in order to reduce complexity you can combine them into a single node labeled "A or B" or "A+B". This reduces the number of distinct nodes and lines in the cognitive network, without losing any information.
![]()
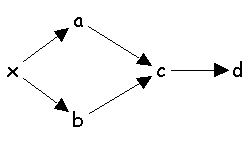
Figure 2. Causal network.
Combining adjacent nodes. Nodes that are adjacent along all legitimate paths in the network may also be combined. Another way of putting this is that if A --> B, and A causes nothing that B does not cause, and B has no other causes (that do not also cause A), then A and B may be combined into "A and B" or "AB". (See Figure 2.)
The two procedures can be used consecutively and iteratively to reduce the network as much as desired. (Although, in general, combining structurally identical nodes is more useful.)
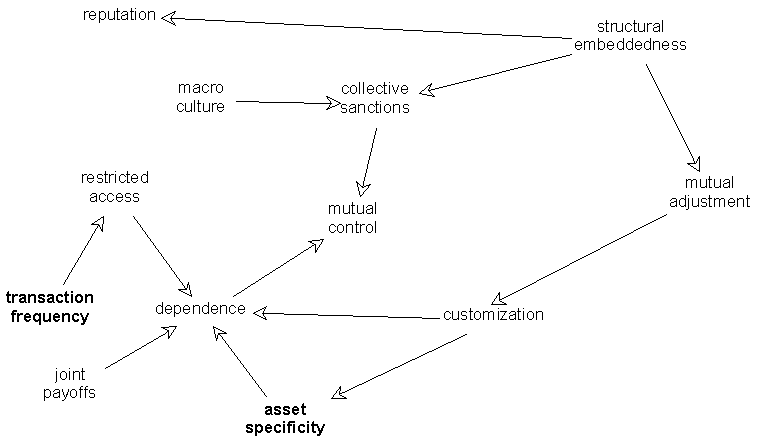
Original Map:
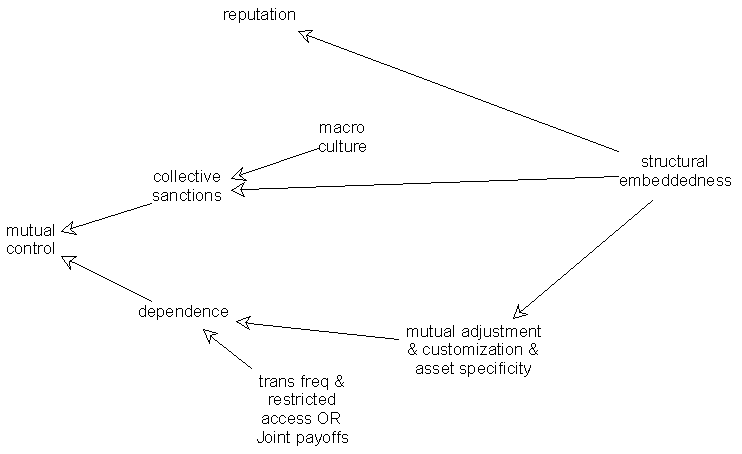
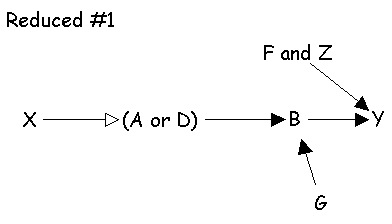
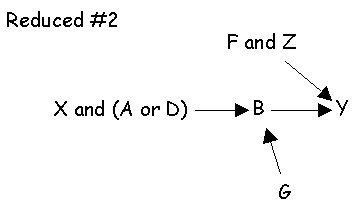
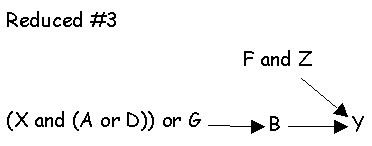
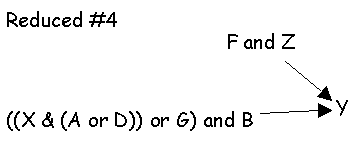
Reduced Map:
The process is formally identical to Ragin's approach to analyzing coded data via boolean algebra.
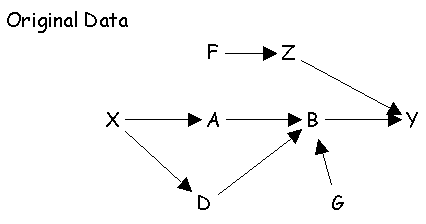
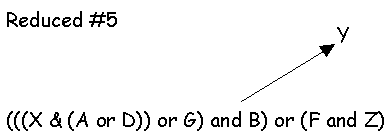
The outcome Y in the original data can be represented as XAB+FZ+XDB+GB = Y. Algebraically, we can rearrange terms to get X(A+D)B+GB+FZ which is equal to (X(A+D)+G)B+FZ.
Which is what we get if we work directly with the diagram:
 |
 |
 |
 |