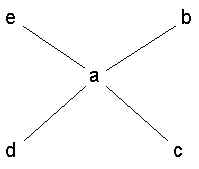
 The "Star" (aka "wheel") |
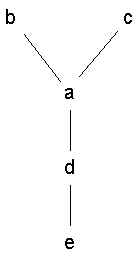 The "Y" |
The "Line" (aka "Chain") |
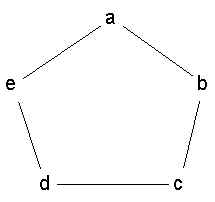 The "Circle"
|
The organization chart of a bureaucratic organization can be thought of as a network. It is a directed graph that records the social relation "reports to" (or, if you prefer the arrows to go downard, "is the boss of"). That social relation tends to channel a lot of the communications within an organization. For example, a lot of prescriptive information (do this, stop doing that) flows downward along the links. It is unusual, and can cause problems, when prescriptive information moves in a different pattern, such as from a boss to someone else's subordinate, or among peers, or (God forbid) from a subordinate to a supervisor.
At the same time, a lot of descriptive ('this is the status of such-and-such project') flows up the links, often in the form of reports or presentations.
The organization also controls or determines a lot of other communication as well. For example, most roles (jobs) within an organization are interlinked, forcing occupants of those roles to interact with others playing their own roles. For example, both the personnel and the payroll departments generally have to interact on an occasional basis with all employees. People in the marketing research department work closely with people in the marketing department, who also work with people in the new product development department.
In addition to these formally prescribed communications, there are also multitudes of informal communications, ranging from getting technical advice to sexual harrassment. Some of these are caused or enabled by aspects of the official organizational structure (e.g., most communication occurs between people who are assigned offices that are within 50 feet of each other), but others are not.
Given that there are many ways to organize an organization, the question arises how the pattern of communications within the organization affects the performance of the organization -- it's ability to sell products, reduce costs, adapt to changes in environment, etc.
One way to investigate this question is to perform controlled lab experiments. This is what Alex Bavelas and his student Harold Leavitt at MIT did in the late 40s and 50s.
Basically, the experiment had 5 people play a game in which they have to solve a puzzle. At the start of the game, each person is given a unique bit of information. In order to solve the puzzle, everyone's bit of information must be pooled together. The players communicate with each other, transmitting what information they have, until the puzzle is solved. The idea is for every single player to get the answer. The faster, more efficiently they can do it, the better.
Each person is put in a uniquely colored cubicle. They are given colored stationary matching their cubicle. There are slots in the wall where they can send and receive messages in tubes (hey, this was the 40s -- today we would do the experiment using email).
At the start of each game, each person is given 5 symbols chosen from a set of six. The objective is to discover which symbol they all have in common. Each cubicle has 6 switches on the wall, labeled by the symbols. When a player learns the answer he (they were all men) flips the switch corresponding to the symbol he believes everyone has in common. The experimenters record the time when that happens. When all 5 subjects have flipped a switch, the experimenter calls a halt to the game and records whether they got it right.
If the game has not yet been halted, a subject could change his answer if he likes. Subjects are free to write anything they like on the their messages, and to send as many or as few as they like.
The cubicles do not all contain the same number of slots. Some cubicles might have just one slot, which would mean that the subject in that cubicle could only message one person (whoever is at the other end of the tube). The slots serve to restrict communications into certain patterns. Four separate patterns were tested: the star (wheel), the Y, the chain (line), and the circle.
The "Star" (aka "wheel") |
The "Y" |
The "Line" (aka "Chain") |
The "Circle"
|
The subjects were not told what pattern they were in, or even that they were in a pattern.
The same set of subjects played the game in the same positions 15 times.
Time. The wheel and Y were considerably faster, on average, than the chain and circle.
Messages. The wheel and Y used the least number of messages. The chain was next, then the circle (which used quite a bit more).
Errors. An error was defined as the throwing of an incorrect switch before the end of a game. The wheel, the Y and chain made the fewest errors, while the circle made the most (however, the circle had the most error corrections).
Satisfaction. The subjects in a the circle network enjoyed themselves the most, followed by the chain, the Y and finally the wheel.
Leadership. The probability of opining that the group had a leader went up in the order: circle, chain, Y, and wheel. In addition, agreement as to who was the leader increased in the same order (it was 100% in the case of the wheel).
Improvement. Circle people were very likely to say that they could have done things more efficiently and that was missing was "a system". Wheel people did not feel they could improve much.
Which structure should have been the fastest? Theoretically, the wheel can solve the puzzle in a minimum of 5 time units, the Y in 4, the chain in 5, and the circle in just 3. So the circle should have been the fastest. However, the actual experimental results were exactly the opposite. Now, it's easy to think 'big deal: people are not computers. they don't necessarily do things in the mathematically most efficient way.'
But if that were all there was to it, none of the structures would have performed consistently better than the others. There is clearly SOME effect of structure on performance, just not the one we expected.
So what is the relationship? According to Bavelas and Leavitt, it's centralization. The more centralized a structure is, the better it performs. They use "centralization" to refer to the overall distance that nodes are from the most central node, who acts as an information integrator. The closer everyone is to that integrator, the faster the puzzle is solved. Of course, channeling all information to a single integrator is not the only possible strategy for solving problems. But it is a reasonable strategy that is easy to implement and which works well with simple problems. People seem to gravitate toward that kind of solution naturally, and so structures that lend themselves to funneling to an obvious center tend to perform better. In the centralized systems, the most central node is clearly more central than all the other nodes. This makes clear who the leader is, and also makes the funnel-everything-to-an-integrator strategy more obvious. So centralized systems don't waste time searching for a strategy nor vying for leadership: they just do it.
Later research, however, has shown that centralization is not always optimal. The next table shows under which conditions and criteria centralized vs decentralized systems are best.
| Variable | Simple Task | Complex Task |
|---|---|---|
| Fewest messages | centralized | centralized |
| Least time | centralized | decentralized |
| Least errors | centralized | decentralized |
| Most satisfaction | decentralized | decentralized |
Centralized systems don't work as well with complex tasks because some problems are too big for an individual to handle: the whole idea is to use the entire organization as a distributed processing unit to solve problems that no one person could possibly handle. Also, with large systems (many nodes) central nodes can be overwhelmed with communications. In addition, in such systems, most of the network remains idle while waiting for information to filter back from the center.
Leavitt also analyzed the data by position in the network -- i.e., by node. He found that:
An interesting implication of the Bavelas-Leavitt research is that one path to leadership is centrality. A later experiment by Rogge examined this question in detail. She gave psychological tests to people to determine which ones had high leadership, extroversion, dominance tendencies and which ones had the opposite. She then put the NON-leaders into the central positions of the communication networks and let them play the game. The question was, would the wall-flowers remain wall-flowers, or would they turn into leaders. The answer was that after initially evading responsibility, they eventually became leaders.
In these experiments, it was initially thought that the winning networks would be those whose pattern allowed the spread of information in the minimum time. This is a structural characteristic. However, it turned out that another structural characteristic, centralization, seemed to have more effect.
One reason for this is that in the centralized systems, the number of possible patterns of communication was much smaller. People were more or less forced to adopt a certain strategy for solving the problem. In contrast, for the circle, there were many many possibilities, only a few of which worked well. Even if they all worked well, it was much harder for people to choose one strategy and stick to it. It is often the case in organizations that a satisfactory strategy that is easy to find, implement and stick to is superior to an optimal strategy that is hard to find, hard to implement, and hard to stick with.
It is also helpful if the strategy that a structure pushes people towards is one that people are naturally positively disposed towards. For example, people readily understand leadership. It is much harder to understand the system which, in the circle, would actually lead to much faster performance than the integrator strategy.
| Copyright ©1997 Stephen P. Borgatti | Revised: January 13, 1997 | Home Page |