|
 |
||||||||||||||||||||||||||||||||||||||||||||||||||||||||||||||||
1. Questionnaires.
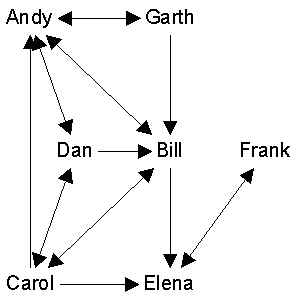
There are several ways to collect questionnaire data. The main way is what I call "row-based" which means that each questionnaire forms one row in the adjacency matrix of the group as a whole. That is, in the adjacency matrix below, the questionnaire administered to Andy yielded the data entered in the first rows. The questionnaire administered to Bill yielded the second row, and so on. This means that even though analytically we usually the entire matrix as one thing, each row was actually obtained from a different source, and could have its own measurement idiosyncracies (such as bias).
|
|
||||||||||||||||||||||||||||||||||||||||||||||||||||||||||||||||
Another way is "row and column based", where each person is asked not only who they give advice to, but who they receive it from. That means that for any pair, such as Andy and Bill, we have two data points: one from Andy, and one from Bill. We then need to employ some kind of rule to decide what number goes in the matrix: is it a one if either of them say it is a one? Or only if both say it is a one? Or do we put the average, so that the values range from 0 to 1/2 to 1?
A third way is the "consensus method" proposed by David Krackhardt. Here, each member of the group is asked to indicate the relationships among every pair of persons. The result is that for any pair of persons, say Andy and Bill, we have N data points, and again we need some kind of rule for deciding what the "right" answer is.
2. Direct Observation
There are two basic approaches to direct observation. One is to plant an observer in a room and record all interactions that take place in front of the observer. The other is the time allocation method, used in ethology, where the observer shows up at various places at random times and records who is doing what to whom over a very short interval.
3. Written Records
Examples include:
4. Experiments
Several studies in the past have planted rumors in schools and observed the spread over time. Stanley Milgram, in a series of studies, examined how many links was required to connect any two randomly chosen persons in the US. These studies were the basis for the play "Six Degrees of Separation" (later a movie starring Will Smith) and the Kevin Bacon Game.
5. Derivation
Given actor-by-event or actor-by-group data, we can always construct an actor-by-actor matrix by counting the number of events/groups that each pair of actors has in common. For example, Davis, Gardner and Gardner (1941) looked through the newspaper society pages and recorded which women were reported to have attended which society event:
| 1 | 2 | 3 | 4 | 5 | 6 | 7 | 8 | 9 | 10 | 11 | 12 | 13 | 14 | |
|---|---|---|---|---|---|---|---|---|---|---|---|---|---|---|
| EVELYN | 1 | 1 | 1 | 1 | 1 | 1 | 0 | 1 | 1 | 0 | 0 | 0 | 0 | 0 |
| LAURA | 1 | 1 | 1 | 0 | 1 | 1 | 1 | 1 | 0 | 0 | 0 | 0 | 0 | 0 |
| THERESA | 0 | 1 | 1 | 1 | 1 | 1 | 1 | 1 | 1 | 0 | 0 | 0 | 0 | 0 |
| BRENDA | 1 | 0 | 1 | 1 | 1 | 1 | 1 | 1 | 0 | 0 | 0 | 0 | 0 | 0 |
| CHARLOTTE | 0 | 0 | 1 | 1 | 1 | 0 | 1 | 0 | 0 | 0 | 0 | 0 | 0 | 0 |
| FRANCES | 0 | 0 | 1 | 0 | 1 | 1 | 0 | 1 | 0 | 0 | 0 | 0 | 0 | 0 |
| ELEANOR | 0 | 0 | 0 | 0 | 1 | 1 | 1 | 1 | 0 | 0 | 0 | 0 | 0 | 0 |
| PEARL | 0 | 0 | 0 | 0 | 0 | 1 | 0 | 1 | 1 | 0 | 0 | 0 | 0 | 0 |
| RUTH | 0 | 0 | 0 | 0 | 1 | 0 | 1 | 1 | 1 | 0 | 0 | 0 | 0 | 0 |
| VERNE | 0 | 0 | 0 | 0 | 0 | 0 | 1 | 1 | 1 | 0 | 0 | 1 | 0 | 0 |
| MYRNA | 0 | 0 | 0 | 0 | 0 | 0 | 0 | 1 | 1 | 1 | 0 | 1 | 0 | 0 |
| KATHERINE | 0 | 0 | 0 | 0 | 0 | 0 | 0 | 1 | 1 | 1 | 0 | 1 | 1 | 1 |
| SYLVIA | 0 | 0 | 0 | 0 | 0 | 0 | 1 | 1 | 1 | 1 | 0 | 1 | 1 | 1 |
| NORA | 0 | 0 | 0 | 0 | 0 | 1 | 1 | 0 | 1 | 1 | 1 | 1 | 1 | 1 |
| HELEN | 0 | 0 | 0 | 0 | 0 | 0 | 1 | 1 | 0 | 1 | 1 | 1 | 1 | 1 |
| DOROTHY | 0 | 0 | 0 | 0 | 0 | 0 | 0 | 1 | 1 | 1 | 0 | 1 | 0 | 0 |
| OLIVIA | 0 | 0 | 0 | 0 | 0 | 0 | 0 | 0 | 1 | 0 | 1 | 0 | 0 | 0 |
| FLORA | 0 | 0 | 0 | 0 | 0 | 0 | 0 | 0 | 1 | 0 | 1 | 0 | 0 | 0 |
In the matrix, the rows are the women, and the columns are events they may have attended.
We can construct a woman-by-woman matrix by multiplying the matrix times its transpose (Y = XX'). The result is a matrix in which the ijth cell records the number of events that woman I and woman J attended in common.
| EVE | LAU | THE | BRE | CHA | FRA | ELE | PEA | RUT | VER | MYR | KAT | SYL | NOR | HEL | DOR | OLA | FLO | |
| EVELYN | 8 | 6 | 7 | 6 | 3 | 4 | 3 | 3 | 3 | 2 | 2 | 2 | 2 | 2 | 1 | 2 | 1 | 1 |
| LAURA | 6 | 7 | 6 | 6 | 3 | 4 | 4 | 2 | 3 | 2 | 1 | 1 | 2 | 2 | 2 | 1 | 0 | 0 |
| THERESA | 7 | 6 | 8 | 6 | 4 | 4 | 4 | 3 | 4 | 3 | 2 | 2 | 3 | 3 | 2 | 2 | 1 | 1 |
| BRENDA | 6 | 6 | 6 | 7 | 4 | 4 | 4 | 2 | 3 | 2 | 1 | 1 | 2 | 2 | 2 | 1 | 0 | 0 |
| CHARLOTTE | 3 | 3 | 4 | 4 | 4 | 2 | 2 | 0 | 2 | 1 | 0 | 0 | 1 | 1 | 1 | 0 | 0 | 0 |
| FRANCES | 4 | 4 | 4 | 4 | 2 | 4 | 3 | 2 | 2 | 1 | 1 | 1 | 1 | 1 | 1 | 1 | 0 | 0 |
| ELEANOR | 3 | 4 | 4 | 4 | 2 | 3 | 4 | 2 | 3 | 2 | 1 | 1 | 2 | 2 | 2 | 1 | 0 | 0 |
| PEARL | 3 | 2 | 3 | 2 | 0 | 2 | 2 | 3 | 2 | 2 | 2 | 2 | 2 | 2 | 1 | 2 | 1 | 1 |
| RUTH | 3 | 3 | 4 | 3 | 2 | 2 | 3 | 2 | 4 | 3 | 2 | 2 | 3 | 2 | 2 | 2 | 1 | 1 |
| VERNE | 2 | 2 | 3 | 2 | 1 | 1 | 2 | 2 | 3 | 4 | 3 | 3 | 4 | 3 | 3 | 3 | 1 | 1 |
| MYRNA | 2 | 1 | 2 | 1 | 0 | 1 | 1 | 2 | 2 | 3 | 4 | 4 | 4 | 3 | 3 | 4 | 1 | 1 |
| KATHERINE | 2 | 1 | 2 | 1 | 0 | 1 | 1 | 2 | 2 | 3 | 4 | 6 | 6 | 5 | 5 | 4 | 1 | 1 |
| SYLVIA | 2 | 2 | 3 | 2 | 1 | 1 | 2 | 2 | 3 | 4 | 4 | 6 | 7 | 6 | 6 | 4 | 1 | 1 |
| NORA | 2 | 2 | 3 | 2 | 1 | 1 | 2 | 2 | 2 | 3 | 3 | 5 | 6 | 8 | 6 | 3 | 2 | 2 |
| HELEN | 1 | 2 | 2 | 2 | 1 | 1 | 2 | 1 | 2 | 3 | 3 | 5 | 6 | 6 | 7 | 3 | 1 | 1 |
| DOROTHY | 2 | 1 | 2 | 1 | 0 | 1 | 1 | 2 | 2 | 3 | 4 | 4 | 4 | 3 | 3 | 4 | 1 | 1 |
| OLIVIA | 1 | 0 | 1 | 0 | 0 | 0 | 0 | 1 | 1 | 1 | 1 | 1 | 1 | 2 | 1 | 1 | 2 | 2 |
| FLORA | 1 | 0 | 1 | 0 | 0 | 0 | 0 | 1 | 1 | 1 | 1 | 1 | 1 | 2 | 1 | 1 | 2 | 2 |
A similar process can be used to convert a set of coordinates (e.g. latitude and longitude for each US city) into matrix of distances between all pairs of points.
The same process is used to convert monadic attribute data, such as sex, into dyadic attribute data, such as "is the same sex as". For example:
| M | F | F | M | F | |
| Male | 1 | 0 | 0 | 1 | 0 |
| Female | 0 | 1 | 1 | 0 | 1 |
| Female | 0 | 1 | 1 | 0 | 1 |
| Male | 1 | 0 | 0 | 1 | 0 |
| Female | 0 | 1 | 1 | 0 | 1 |
Can people really tell you about their social networks? Marketing researchers have found that consumers can barely tell you what they had for lunch yesterday. Bernard, Killworth and Sailer investigated informant accuracy systematically and found that about 52% of what they said was wrong.
Based on the work of Freeman, Freeman and Romney, as well D'Andrade, DeSoto, and many others, it appears that people's recall of their interactions with others is systematically biased toward what is normal and/or logical. At least this is better than being randomly wrong.
People also tend to remember interactions with people who are important, while forgetting interactions with people that are not.
Some respondents will lie to make themselves look good, since people judge others on who they associate with.
As with any questionnaire, there are also problems with how people interpret the questions. What "friend" means to one person may be very different from what "friend" means to others.
Krackhardt's solution to all this is to get everyone's opinion of everyone's relationship with everyone. So that if a person claims to be friends with everyone, but everyone else agrees that they are friends with no one, we have a clue that they might be lying or misunderstanding the question.
There are two basic approaches to bounding a network: emic and etic. The emic or natural or "realist" approach hopes that natural boundaries exist. So if we ask each druguser who they share needles with, eventually we reach people who do not share needles with anyone that has not yet been named. The emic approach relies on relational criteria to determine who is in or out of the network.
The etic approach imposes arbitrary boundaries based on the needs of the researcher. For example, the research might choose to look at the social networks of the children in the 2nd grade at a certain school. It is understood that the children have ties outside of that group, but for the purposes of the study, these are ignored. The etic approach relies on attributes of the nodes to determine who is in or out of the network.
Can you use a sampling method to study complete networks? In general, the answer is no. However, certain kinds of hypotheses can be tested with sample data. For example, it is possible to estimate the density of a network by looking at ties among a sample of nodes.
| Workshop Home | Steve Borgatti | Analytic Technologies | INSNA | Connections |