| Article |
|---|
CONNECTIONS 20(2):13-22
©1997 INSNA
Guy Hagen, Dennis K. Killinger and Richard B.
Streeter(1)
University of South Florida Technology Deployment Center
INTRODUCTION AND BACKGROUND
In 1995 a federally-sponsored agency in Tampa, Florida undertook an applied social network analysis study. This agency, the Technology Deployment Center, needed a study to assess the dozens of economic development organizations in the Tampa Bay area, each with their own missions, strategies, planning and information resources. Social network analysis was selected for its strength in assessing communication, relations, and cooperation, and inter-organizational environments. As a network study of inter-organizational communication, the study presents a snapshot of Tampa Bay area public organization networks in the rapidly changing field of urban economic development. The research also contributed to a master’s thesis.
The Technology Deployment Center (TDC) at the University of South Florida is a community-directed program for conversion of a high-technology Federal nuclear weapons production facility. This facility, the "DOE Pinellas Star Center" in Largo, Florida, has served as one of the engineering, prototyping, and special components plants for the US nuclear weapons complex for over 30 years. Recently, however, it was scheduled for closure as part of Federal realignment plans. In response to the impending closure, the TDC was initiated in 1995 and has received over $13 Million from the US Department of Energy and US Department of Defense to convert the Pinellas STAR Center resources to commercial use. One of the few successful programs of its kind, the TDC transitions the Pinellas Star Center’s technologies to the private sector through technology development grants and projects to improve local industry infrastructure.
Prior to integrating its economic activities with local resources, the TDC needed to assess the region’s economic development environment. The TDC decided that a quantitative and current study should be performed to help determine an appropriate role for the University and that social network analysis would be an appropriate method for such a study. The explicit goals of this study would be:
RESEARCH DESIGN
In order to assess levels of communication and coordination among economic development organizations in the Tampa Bay area, a written survey was designed. 37 organizations with significant development missions were identified through the 1991 SRI report, phone books, and key economic agencies in the Tampa Bay area. A survey questionnaire was designed to elicit information from which could be constructed a matrix of interorganizational relations and frequency of formal communication. Respondents -- the directors of each surveyed organization -- a completed the one-page questionnaire by indicating that they communicated formally with each other organization on the list daily, weekly, monthly, yearly, or never. Additional economic contacts could be 'written in' for future studies. The questionnaire was administered to the survey population in August, 1995 by mail, with phone and facsimile follow-up. Responses were compiled by September 1, 1995; 31 of 37 organizations provided network communication data for the study. Results were collected into a weighted matrix of network contacts for the 31 responding agencies.
It was intended that social network analysis would be applied to this matrix to identify levels of interorganizational communication, clusters of development activity, and leading organizations. Four network measures were selected to obtain these objectives: centrality, equivalence, centralization, and density. These network parameters are defined in the following way:
Centrality is commonly used to identify network leaders. High network centralities are associated with reputations of power and influence over community affairs or economic sectors (Mizruchi and Galaskiewicz 1994). Two centrality measures were selected: Freeman's degree centrality and Freeman's closeness centrality. Closeness centrality is most frequently used to measure relative access to network resources and information, and can also be interpreted as measuring the degree of independence from others in the network. Similarly, degree centrality measures the overall network activity of individual actors.
In the case of this communication study, access (Freeman's closeness centrality) and control (Freeman's betweenness centrality) were identified as the most useful for indicating levels of network coordination. Network centralization (or global centrality) measures the degree to which an entire network is focused around a few central nodes (Scott 1991). This has particular relevance for an inter-organizational study of coordination and leadership. Turk (1977) claims that interagency network centralization can be equated with coordination. Similarly, Tichy (1980) defines global network centrality as the degree "to which relations are guided by the formal hierarchy," and Irwin and Huges (1992) refer to network centralization as the degree to which an inter-organizational network is "dominated by a few places."
Equivalence is used to identify sets of network actors with similar roles in the network; in this case, economic 'clusters' of development communication / activity. Structural equivalence measures the extent to which certain participants occupy similar positions and serve similar functions, or roles, within the network. Rogers (1974), Galaskiewicz (1979), Galaskiewicz and Krohn (1984), and Knoke (1983) each describe inter-organizational structural equivalence as being based upon organizational function and activity (discussed in Mizruchi and Galaskiewicz 1994). As far as the Tampa Bay economic development network is concerned, these groups are most likely to be defined by the agencies' missions or service delivery specializations. When agency activities are viewed from an economic perspective, they may be referred to as sectors, or 'clusters', as they are in the 1991 SRI report.
Finally, density may be used to measure levels of uncentralized inter-organizational cooperation. Turk (1977) uses the term "coordination" to refer to increased levels of centralized leadership. However, he concedes that public agencies can coordinate their activities without external direction. This describes a form of coordination that does not involve leadership or centralized direction, but that is instead based upon decentralized cooperation. Based on this, it is useful to also examine the overall level of network integration between organizations. Integration and network cohesion are generally measured using the density measure (Scott 1991).
RESULTS AND ANALYSIS
The four network measures presented in the research design were individually analyzed, with the results for each presented below(2)
Table 1
Freeman's Centrality Scores for Surveyed Tampa Bay Economic
Development Organizations Based Upon
Communication Frequency
| Organization | Code | Closenessa | Degreea | Closenessb | Degreeb |
| Committee of 100 | 100 | 96.77 | 57 | 2.07 | 1.68 |
| Community Reuse Organization (CRO) | CRO | 65.22 | 30 | -0.94 | -0.45 |
| Department of Defense (DOD) | DOD | 63.83 | 24 | -1.08 | -0.92 |
| Department of Energy (DOE) | DOE | 78.95 | 43 | 0.37 | 0.58 |
| Economic Development Administration | EDA | 73.17 | 35 | -0.18 | -0.05 |
| Enterprise Corporation of Tampa Bay (TEC) | TEC | 93.75 | 66 | 1.78 | 2.39 |
| Enterprise Florida | EF | 71.43 | 30 | -0.35 | -0.45 |
| Florida Department of Commerce | DOC | 85.71 | 50 | 1.02 | 1.13 |
| Florida State Economic Services | ESD | 76.92 | 29 | 0.17 | -0.53 |
| Greater Pinellas Park Chamber of Commerce | GPP | 68.18 | 22 | -0.66 | -1.08 |
| Hillsborough Cty City-County Planning Commission | HCP | 65.22 | 32 | -0.94 | -0.29 |
| Hillsborough Cty Commerce Department | HCC | 83.33 | 44 | 0.79 | 0.65 |
| Hillsborough Cty Metropolitan Planning Organization | HCM | 81.08 | 40 | 0.57 | 0.34 |
| Hillsborough Cty Planning Development Department | PDD | 61.22 | 20 | -1.33 | -1.23 |
| Lockheed Martin Specialty Components (LMSC) | LM | 69.77 | 34 | -0.51 | -0.13 |
| Metropolitan Tampa Bay Capital Initiative | MTB | 96.77 | 65 | 2.07 | 2.31 |
| South Tampa Chamber of Commerce | STC | 60 | 14 | -1.44 | -1.71 |
| Southern Technology Applications Center | STA | 85.71 | 42 | 1.02 | 0.5 |
| St. Petersburg Area Chamber of Commerce | SPC | 69.77 | 26 | -0.51 | -0.76 |
| St. Petersburg/ Clearwater Economic Development Council | CED | 83.33 | 49 | 0.79 | 1.05 |
| Tampa Bay Economic Development Corporation | TED | 78.95 | 38 | 0.37 | 0.18 |
| Tampa Bay Partnership | TBP | 76.92 | 40 | 0.17 | 0.34 |
| Tampa Bay Regional Planning Council | RPC | 69.77 | 29 | -0.51 | -0.53 |
| Tampa Downtown Partnership | TDP | 73.17 | 40 | -0.18 | 0.34 |
| Tampa Port Authority | TPA | 88.24 | 44 | 1.26 | 0.65 |
| Tampa / St. Pete Minority Business Development Center | MBD | 65.22 | 17 | -0.94 | -1.47 |
| United States Small Business Administration | SBA | 83.33 | 39 | 0.79 | 0.26 |
| University of South Florida Division of Sponsored Research | DSR | 71.43 | 35 | -0.35 | -0.05 |
| University of South Florida I3 Center | I3 | 63.83 | 22 | -1.08 | -1.08 |
| Univ. of S. Florida Tech. Deployment Center (TDC) | TDC | 66.67 | 28 | -0.8 | -0.6 |
| Westshore Alliance | WA | 60 | 22 | -1.44 | -1.08 |
aRelative. bStandardized
Table 1 presents the results from the centrality analysis, consisting of Tampa Bay area organizations that participated in the survey, their respective survey codes, and the relative centralities for each. Combined, the Freeman's Closeness and Degree measures identified a single group of agencies with unusually high centralities, including the Enterprise Corporation of Tampa Bay (TEC, now essentially incorporated into the University of South Florida's College of Business), the Florida Department of Commerce (now privatized as Enterprise Florida), the Metropolitan Tampa Bay Capital Initiative, the Southern Technology Applications Center (STAC), the St. Petersburg / Clearwater Economic Development Council, and the Tampa Port Authority.
The centralization index based upon Freeman's closeness measures for the Tampa Bay network is .46, and the Freeman's betweenness centralization index is .05.
These results can be compared to previous studies, such as a network study by Wolfe (1995) of 588 Tampa Bay social service organizations. In this study, the closeness centralization was .58 and the betweenness centralization index was .23. This comparison study attempted to identify linkages between organizations serving families and children in Hillsborough and Pinellas (central Tampa Bay area) counties, in five different areas: staff, program, fiscal, client, and administrative linkages. The comparison study itself referred to an earlier, 1985 study wherein the social service network betweenness and closeness centralization scores were even higher.
A few conclusions can be drawn from these comparisons. Even though the economic development network was less than a tenth the size of the comparison network, it had lower levels of centralization. The closeness centralization score is moderately low, implying low-to-medium levels of centralized access to economic development resources. The betweenness centralization score is also relatively small, indicating the network does not exhibit much control by a few organizations over economic information resources. In sum, the overall level of centralized coordination in Tampa Bay economic development is low.
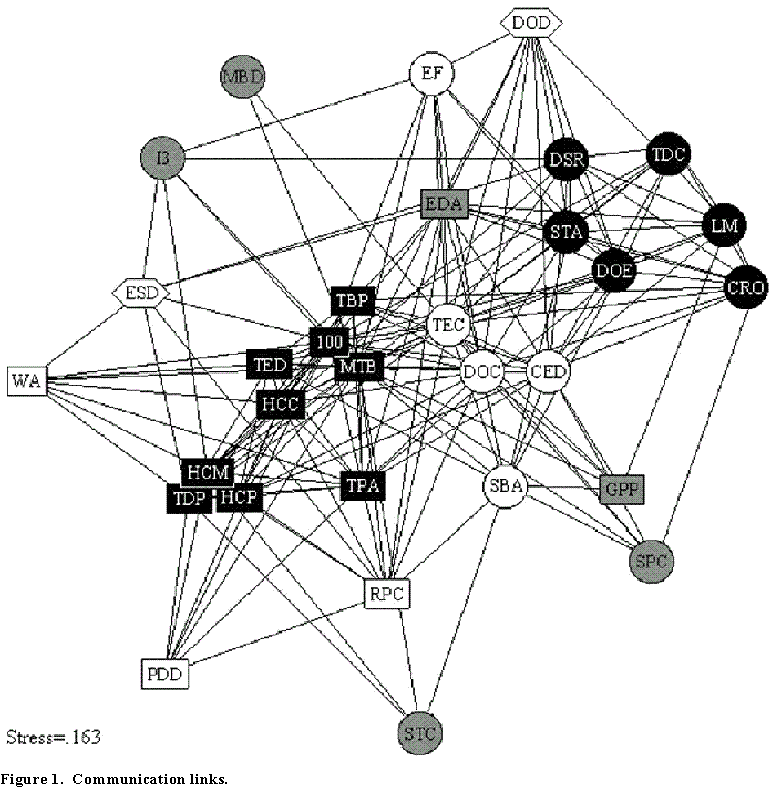
Figure 1 presents a multi-dimensional scaling of the network adjacency matrix.(3). In general, organizations (identified by codes from Table 1) near the center of the graph have higher centralities (and consequently higher levels of information access and leadership potential). Furthermore, the relative proximity of an organization to another organization on the graph is roughly indicative to shared communication levels. Formal interaction between any two organizations with a frequency of monthly or greater is indicated by a connecting line between those organizations. "Clusters" of organizations (as indicated by structurally equivalent sets) are differentiated by color and shape.
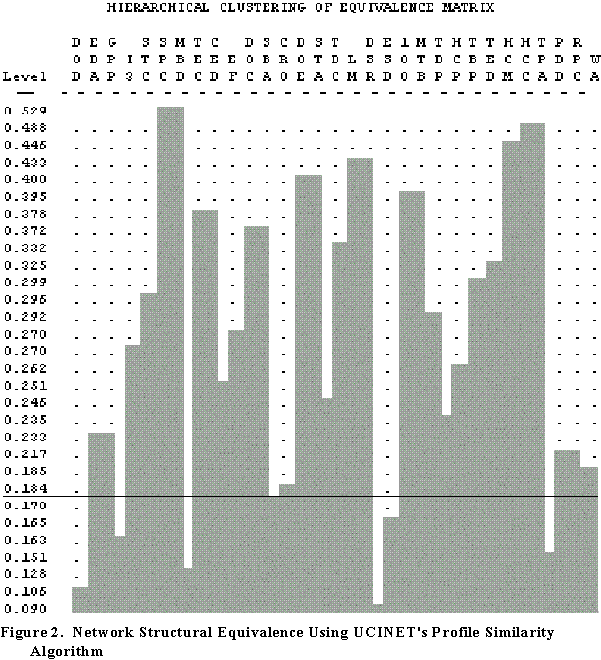
Results from the equivalence analysis are presented in Figure 2, consisting of a hierarchical cluster diagram. This diagram identifies various levels of structurally equivalent sets in the network. It was observed that a number of technology-oriented organizations had similar functions, and that criterion level 0.184 was the most inclusive level that maintained them as distinct, socially relevant sets.
Using identification codes from Table 1, organizations in Fig. 2 connected horizontally by gray blocks at a particular level share set membership at that level. The sets identified as structurally equivalent at level 0.184 have been listed in Table 2, with a tentative explanation of the roles they may perform in the network(4).
In this study, the matrix has 31 nodes and 409 active links, resulting in a density of .44. The Tampa Bay economic development network is considerably more integrated than the social services network compared for centralization scores, which had a density of .062 (Wolfe 1995). Considering the small size of the network and overlapping interests and resources, this number suggests that the overall communication network is at least moderately integrated or cohesive.
The sets identified by structural equivalence were highly suggestive of specialized economic 'sectors', and appeared highly compatible with open-systems models of economics (Tichy 1980, Katz & Kahn 1971) or similar applied models of technology development (such as presented by Mohawk Research Corporation 1989). Future network studies integrated with a comprehensive model of economic and organizational development may confirm structural equivalence as a useful tool for identifying and planning organizational roles in regional economics or as an alternate method for economic cluster analysis.
Table 2
Survey Organization Equivalence
Sets Identified Via Hierarchical
Clustering
Business
and Economic Development
|
High-Technology
& Defense Conversion
|
Enterpreneurship
|
Local Chambers &
Specialized Business
|
Infrastructure
Planning
|
Local Chambers and
Peripheral
|
In general, social network analysis has served to support some of the observations made in the SRI report, particularly concerning low levels of coordinated leadership: "A major obstacle to progress is the reality that Tampa / Hillsborough's current leadership for economic development is seriously fragmented" (1991). However, this study has also suggested that Tampa Bay area organizations work both with and without the cooperation of other agencies in general policy categories. Recently, these conclusions have been echoed by independent consultants hired to assess Tampa Bay's industries, who stated that there is a high level of parallel, but unlinked, effort among Tampa Bay economic development organizations, as high technology industries (microelectronics, telecommunications, biotechnology, and aerospace) are becoming increasingly recognized as critical to all aspects of regional economy, including education, social services, labor, industry, power and more; in the words of Cornell and Nuese (1997):
"[economic development through] information technology is bubbling through 'grass roots' cooperation between Tampa Bay organizations. Although many organizations in the community are working in the same direction, they have not reached 'critical mass' necessary to make the significant leap to the next level of industrial / economic activity."
Turk argues that the natural state of public agency networks is uncoordinated (1977). In an environment where agencies must compete for some resources yet cooperate to accomplish certain goals, they will resist efforts to be incorporated with other organizations or become otherwise centrally directed. In the survey network, such low coordination may then be expected for a network of public / private economic development organizations. However, the centralization and density results suggest that Tampa Bay economic development organizations temporarily cooperate in projects of shared interest, but that this cooperation is neither comprehensively planned nor directed. Agencies with particularly high centralities, however, may serve as leaders in identifying critical issue areas or sources of information concerning the state of the region's economy.
CONCLUSIONS AND IMPLICATIONS
Economic development is a constantly changing process between organizations that increase and decrease in influence. Soon after this survey was conducted, increasing interest among Tampa Bay economic development organizations began to develop around high-technology issues. This has resulted in large industry initiatives such as the "I-4 High Technology Corridor" consortium led by the University of South Florida and the University of Central Florida, which incorporates the efforts of dozens of organizations and corporations with an interest in transforming regional industrial infrastructure (Weatherman & Page 1997). Currently, the I-4 Corridor Council is one of the single most active and influential organizations in the Tampa Bay region. It is expected that this development has caused significant changes to the network presented in this article, probably increasing overall network density, the centrality of individual organizations, and enlarging technology-oriented equivalence sets.
Exceptionally high levels of public investment are required to initiate high technology industries. Recognition of this fact probably gives considerable impetus to regional technology initiatives, but without a coordinating entity it may lack the momentum necessary to actually transform regional industrial infrastructure. The extent to which the University of South Florida or the I-4 Corridor Council serves to fulfill this leadership role will be demonstrated by the success of large-scale economic initiatives in 1998 and 1999.
The Technology Deployment Center has aligned itself with other key organizations and groups to further its mission. As a snapshot of inter-organizational environments, this study may be of value to other regional development agencies and organizations seeking rapid assessment, planning, or research and planning tools.
REFERENCES
Borgatti, S.P., M.G. Everett, & L.C. Freeman. 1992. UCINET IV Version 1.00. Columbia: Analytic Technologies.
Cornell, Jon E. & Charles Nuese. 1997. The Role of the Tampa Bay Area in the Florida / I-4 Corridor Microelectronics Initiative. Report presented to the USF/UCF I-4 Corridor Council. Tampa, Florida: Concurrent Technology Enterprises, LC.
Galaskiewicz, J. 1979. Exchange Networks and Community Politics. Beverly Hills, CA: Sage.
Galaskiewicz, J. & K. Krohn. 1984. Positions, Roles, and Dependencies in a Community Interorganization System. Sociological Quarterly 25: 527-550.
Irwin, Michael & Holly Huges. 1992. Centrality and the Structure of Urban Interaction: Measures, Concepts and Applications. Social Forces 71 (1): 17-52.
Katz, Daniel & Robert L. Kahn. 1971. Organizations and Open-Systems Theory: A Summary. In Readings in Organization Theory: Open-System Approaches. John G. Maurer, ed.: 13-19. New York: Random House.
Knoke, D. 1983. Organization Sponsorship and Influence Reputation of Social Influence Associations. Social Forces 61: 1065-1087.
Krackhardt, David, J. Blythe, & C. McGrath. 1994. Krackplot 3.0: An Improved Network Drawing Program. Connections 17 (2): 53-55.
Mizruchi, Mark S. & Joseph Galaskiewicz. 1994. Networks of Interorganizational Relations. In Advances in Social Network Analysis: Research in the Social and Behavioral Sciences. Stanley Wasserman and Joseph Galaskiewicz, eds.: 230-253. Thousand Oaks, California: Sage Publications.
Mohawk Research Corporation. 1989. From Invention to Innovation: Commercialization of New Technology by Independent Small Business Inventors. Washington, D.C.: U.S. Department of Energy.
Rogers, David. 1974. Sociometric Analysis of Interorganizational Relations: Application of Theory and Measurement. Rural Sociology 39: 487-503.
Scott, John. 1991. Social Network Analysis: A Handbook. Newbury Park, California: Sage Publications.
Stanford Research Institute, Center for Economic Competitiveness. 1991. Tampa and Hillsborough County In Transition: A Strategy for Economic Prosperity. Menlo Park, California: SRI International.
Tichy, Noel. 1980. A Social Network Perspective for Organization Development. In Systems Theory for Organization Development. T. G. Cummings, ed.: 115-162. Great Britain: John Wiley & Sons, Ltd.
Turk, Herman. 1977. Organizations in Modern Life. San Francisco: Jossey-Bass.
Weatherman, Lynda L. & Drew Page. 1997. I-4 High Technology Corridor Initiative (briefing). Orlando, Florida:GTE Corp.
Wolfe, Alvin W. 1995. Regular Equivalence Clusters in Large Networks Containing Hierarchies: Problems of Interpretation. Paper presented at the International Social Networks Conference. July 7, 1995, London, England.
1. University of South Florida Technology Deployment Center; 4202 East Fowler Avenue, PHY114; Tampa, Florida 33620
2. Network analysis was conducted using the UCINET IV network analysis program (Borgatti, Everett and Freeman 1992).
3. The MDS figure was generated using the Krackplot 3.0 network drawing program (Krackhardt, Blythe, and McGrath 1994).
4. Shared set membership does not imply redundancy, as these organizations may have different strategies, resources, and clientele populations.