Sociograms and Graph Theory
A graph diagram 2 aims to represent each row or column in an incidence matrix - each of the cases or affiliations under investigation - by a point on the paper. Once the appropriate adjacency matrix has been derived, the 'I' and 'O' entries in the cells of the matrix, representing the presence or absence of a relation, can be indicated by the presence or absence of lines between the points. In Figure 3.5, for example, the symmetrical 4-by-4 adjacency matrix of companies can be drawn as a four point graph containing six lines, which correspond to the non-zero entries in the matrix.
In a graph, it is the pattern of connections that is important, and not the actual positioning of the points on the page. The graph theorist has no interest in the relative position of two points on the page, the lengths of the lines which are drawn between them, or the size of character used to indicate the points. Graph theory does involve concepts of length and location, for example, but these do
68 Social network analysis
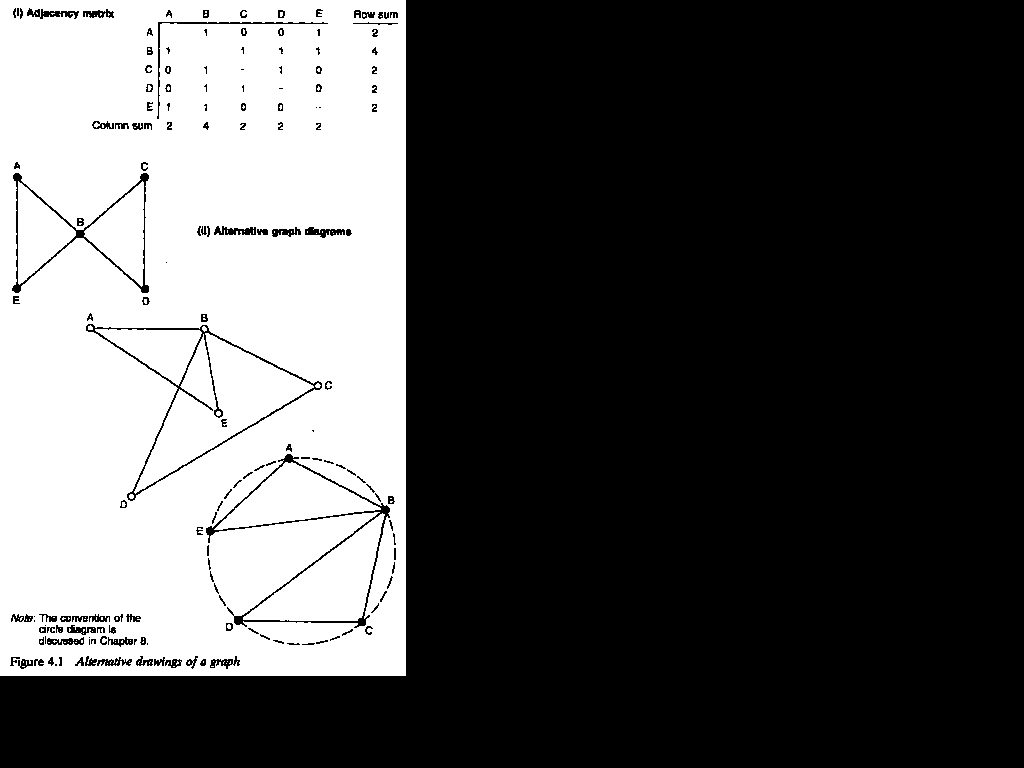
not correspond to those concepts of physical length and location with which we are most familiar. It is usual in a graph diagram to draw all the lines with the same physical length, wherever this is possible, but this is a purely aesthetic convention and a matter of practical convenience. Indeed, it is not always possible to maintain this convention if the graph is to be drawn with any clarity. For this reason, there is no one 'correct' way to draw a graph. The graph diagrams in Figure 4.1, for example, are equally valid ways of drawing the same graph - all convey exactly the same graph theoretical information.
The concepts of graph theory, then, are used to describe the pattern of connections among points. The simplest of graph theoretical concepts refer to the properties of the individual points and lines from which a graph is constructed, and these are the building blocks for more complex structural ideas. In this chapter I shall review these basic concepts and show how they can be used to give an overview of both the ego-centric and the global features of networks. Subsequent chapters will explore some of the more complex concepts.
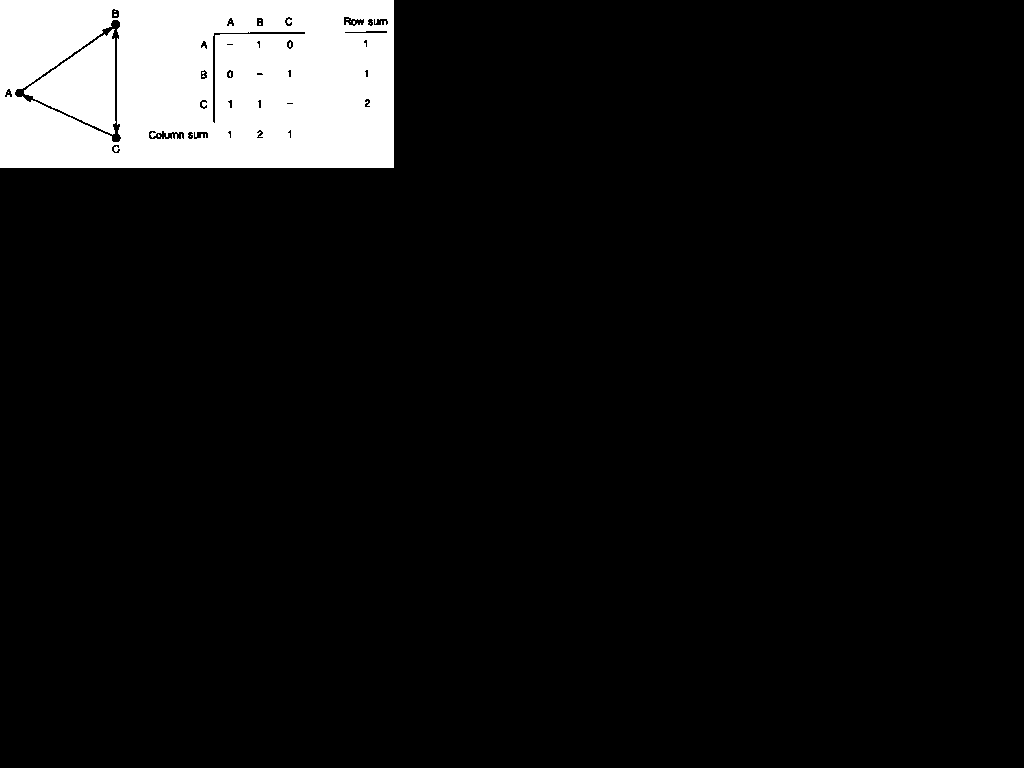
It is necessary first to consider the types of lines that can be used in the construction of graphs. Lines can correspond to any of the types of relational data distinguished in Figure 3.6: undirected, directed, valued or both directed and valued. The graphs in Figure 4.1 consist of undirected lines. These graphs derive from a symmetrical data matrix where it is simply the presence or absence of a relation which is of importance. If the relations are directed from one agent to another, then they can be represented in a directed graph, sometimes termed a 'digraph'. A directed graph is represented in drawn form by attaching an arrow head to each line, the direction of the arrow indicating the direction of the relation. Figure 4.2 shows a simple directed graph.
If, on the other hand, the intensity of the relation is an important consideration and can be represented by a numerical value, the researcher can construct a valued graph in which numerical values are attached to each of the lines. I have already shown that a matrix for a directed graph will not usually be symmetrical, as relations will not normally be reciprocated. A matrix for a valued graph may or may not be symmetrical, but it will contain values instead of simple binary entries. 3 An example of a valued graph is that in Figure 3.5. One of the simplest and most widely used measures of intensity is the multiplicity of a line. This is simply the number of separate contacts which make up the relationship. If, for example, two companies have two directors in common, the relation between the two companies can be represented by a line of multiplicity 2. If they

70 Social network analysis

Figure 4.2 A directed graph and its matrix
have three directors in common, the interlocking directorship can be seen as a line of multiplicity 3. The values in a graph can, of course, relate to any other suitable measure of intensity, such as, for example, the frequency of the relation.
The fundamental ideas of graph theory can most easily be understood in relation to simple undirected and un-valued graphs. A number of apparently straightforward words are used to refer to graph theoretical terms, and it may appear pedantic to define these at great length. But these definitional matters are important, as the apparently simple words are used in highly specific and technical ways. It is essential that their meanings are clarified if the power of graph theory is to be understood.
Two points which are connected by a line are said to be adjacent to one another. Adjacency is the graph theoretical expression of the fact that two agents represented by points are directly related or connected with one another. Those points to which a particular point is adjacent are termed its neighborhood, and the total number of other points in its neighbourhood is termed its degree (strictly, its 'degree of connection'). Thus, the 'degree' of a point is a numerical measure of the size of its neighbourhood. The degree of a point is shown by the number of non-zero entries for that point in its row or column entry in the adjacency matrix. Where the data are binary, as in Figure 4.1, the degree is simply the row or column sum
for that point. Because each line in a graph connects two points -- is 'incident' to two points -- the total sum of the degrees of all the points in a graph must equal twice the total number of lines in the graph. The reason for this is that each line is counted twice when calculating the degrees of the separate points. This can be confirmed by examining Figure 4. 1. In this graph, point B has a degree of 4 and all the other points have a degree of 2. Thus, the sum of the degrees is 12, which is equal to twice the number of lines (six).
Lines, direction and density 71
Points may be directly connected by a line, or they may be indirectly connected through a sequence of lines. A sequence of lines in a graph is a 'walk', and a walk in which each point and each line are distinct is called a path. The concept of the path is, after those of the point and the line, one of the most basic of all graph theoretical concepts. The length of a path is measured by the number of lines which make it up. In Figure 4. 1, for example, points A and D are not directly connected by a line, but they are connected through the path ABD, which has a length of 2. A particularly important concept in graph theory is that of 'distance', but neither distance nor length correspond to their everyday physical meanings. The length of a path, I have said, is simply the number of lines which it contains - the number of 'steps' necessary to get from one point to another. The distance between two points is the length of the shortest path (the 'geodesic') which connects them.

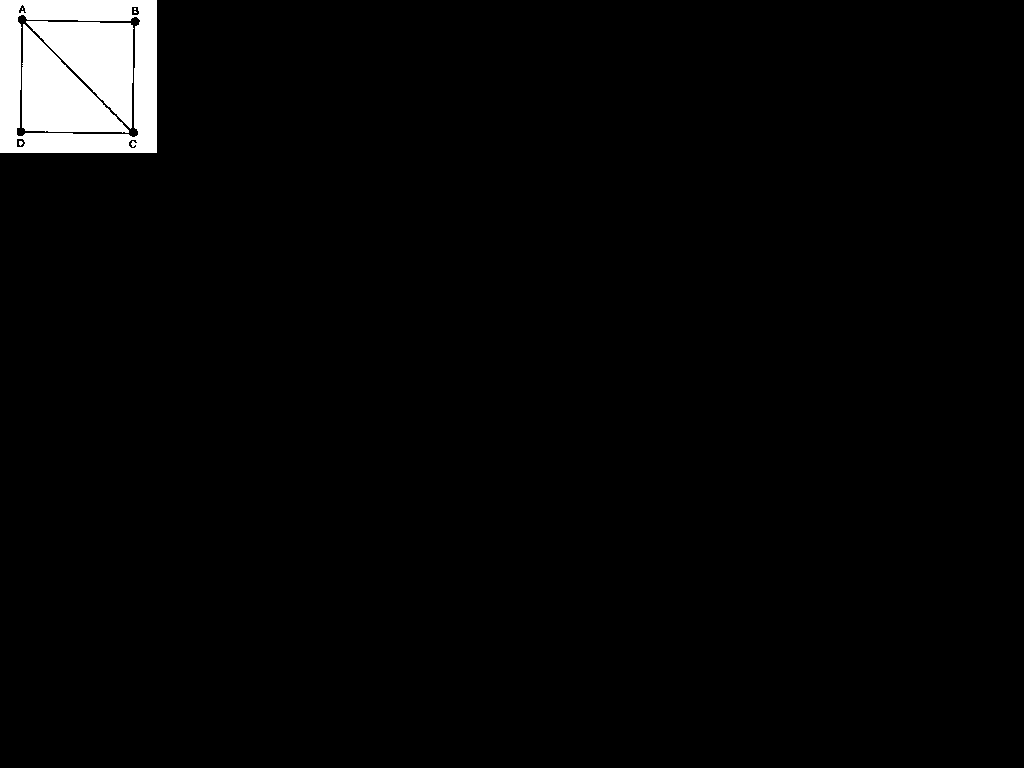
Figure 4.3 Lines and paths
Consider the simple graph in Figure 4.3. In this graph, AD is a path of length 1 (it is a line), while ABCD is a path of length 3. The walk ABCAD is not a path, as it passes twice through point A. It can be seen that points A and D are connected by three distinct paths: AD at length 1, ACD at length 2, and ABCD at length 3.' The distance between A and D, however, is the length of the shortest path between them, which, in this case, is 1. The distance between points B and D, on the other hand, is 2. Many of the more complex graph theoretical measures take account only of geodesics, shortest paths, while others consider all the paths in a graph.
These same concepts can be used with directed graphs, though some modifications must be made to them. In a directed graph lines are directed to or from the various points. Each line must be considered along with its direction, and there will not be the symmetry that exists in simple, undirected relational data. The fact that, for example, A chooses B as a friend does not mean that there
72 Social network analysis
will be a matching friendship choice from B to A. For this reason, the 'degree' of a point in a directed graph comprises two distinct elements, called the 'indegree' and the 'outdegree'. These are defined by the direction of the lines which represent the social relations. The indegree of a point is the total number of other points which have lines directed towards it; and its outdegree is the total number of other points to which it directs lines. The indegree of a point, therefore, is shown by its column sum in the matrix of the directed graph, while its outdegree is shown by its row sum. The column sum of point B in Figure 4.2, for example, is 2, as it ,receives' two lines (from A and from C). The corresponding sociogram shows clearly that its indegree is 2. The row sum for B, on the other hand, is 1, reflecting the fact that it directs just one line, to point C.
A path in a directed graph is a sequence of lines in which all the arrows point in the same direction. The sequence CAB in Figure 4.2, for example, is a path, but CBA is not: the changing direction of the arrows means that it is not possible to 'reach' A from C by 6
passing through B. It can be seen that the criteria for connection are much stricter in a directed graph, as the researcher must take account of the direction of the lines rather than simply the presence or absence of a line. The distance between two points in a directed graph, for example, must be measured only along the paths that can be identified when direction is taken into account. When agents are regarded as either 'sources' or 'sinks' for the 'flow' of resources or information through a network, for example, it is sensible to take serious account of this directional information in analysing the graph of the network. Sometimes, however, the direction of the lines can legitimately be ignored. If it is the mere presence or absence of a line which is important, its direction being a relatively unimportant factor, it is possible to relax the usual strict criteria of connection and to regard any two points as connected if there is a sequence of lines between them, regardless of the directions of the arrows. In such an analysis it is usual to speak of the presence of a ,semi-path' rather than a path. CBA in Figure 4.2 is a semi-path. Treating directed data as if they were undirected, therefore, means that all the usual measures for undirected data may then be used.
| Next Section | Return to Table of Contents |