|
|
|
|
|
|
|
Setup
1. Start up UCINET 6
2. Set default folder to your "datafiles" folder (probably c:\program files\analytic technologies\ucinet 6\datafiles)
3. We will be analyzing the Padgett dataset, which records marriage and business ties among Florentine families in the Renaissance. Recall that the Padgett dataset contains two relations, PADGM (marriage ties) and PADGB (business ties). For some of the measures we will be calculating, you will have to run Data|Unpack to create separate datasets for the two relations.
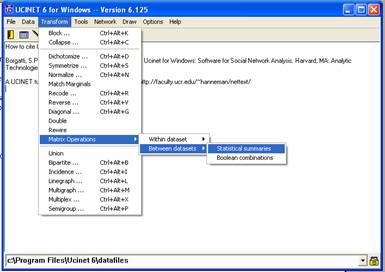
Steps1. Go to Transform > Matrix Operations > Between datasets > Statistical summaries:
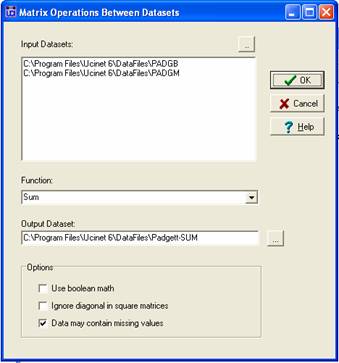
You will be adding together the two relations in this dataset (marriage relation + business relation). Thus, you will be creating a new matrix out of two current matrices. Remember, in each of the two relations (marriage and business), where there is a tie between 2 families, then there will be the value of 1. Where there is no tie, the value is 0. Thus, to add these two matrices together to create a new matrix, UCINET will be doing the following: a. If two families have both a marriage tie (value = 1) and a business tie (value = 1), then the value in the new matrix shall be 2. b. If two families share only one relational tie between them (either marriage or business, but not both), then the value in the new matrix shall be 1. c. If two families do not share any relational tie between them (neither marriage nor business), then the value in the new matrix shall be 0. To do this, fill in the window as is shown below:
3. Select ‘OK’, and your output data matrix should look like this:
4. Go to
NetDraw and open up your new dataset Padgett-SUM.
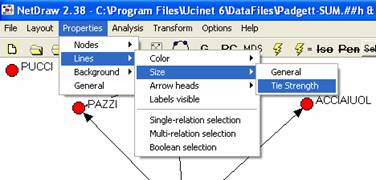
a. Within
NetDraw you will manipulate the graph so that the strength of ties get shown in
the graph. To do this, Go to Properties > Lines > Size > Tie Strength:
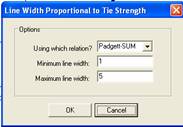
b. When the below window appears, make sure the below entries are also appearing in your window and select OK:
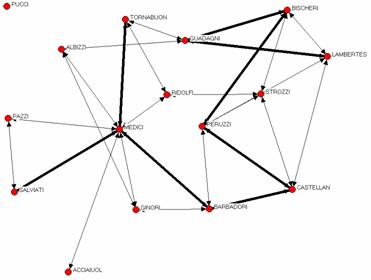
c. The graph that appears should look something like this:
1. These data
do not completely support our discussions re: SWT and Forbidden triangle, and
there are some good reasons for this. Automatically, you should see that the
‘strongest’ ties, i.e. those with a value of 2, are not embedded in triangles.
This goes against the Forbidden Triangle argument that Granovetter articulates.
What might be some reasons for this? Go back and look at how UCINET describes
this dataset and think a little bit about a) the size of this dataset; b) how
we’ve conceptualized and measured tie strength here. 2. Now compare tie strength with wealth. In Ucinet, go to Data > Display. Select the PADW dataset, which gives attribute data for each family: (1) each family's net wealth in 1427 (in thousands of lira); (2) the number of priorates (seats on the civic council) held between 1282-1344; and (3) the total number of business or marriage ties in the total dataset of 116 families:
|
|