|
|
|
|
|
|
|
For this lab you will be creating several new datasets based on a survey conducted by Rich DeJordy. The nodes are students in Rich's 2-week course at the University of Essex. The exercise makes use of some attribute data that you can find here. Note that the data have deliberately not been cleaned. In addition, there is some network data provided in visual form -- i.e., the following diagram:
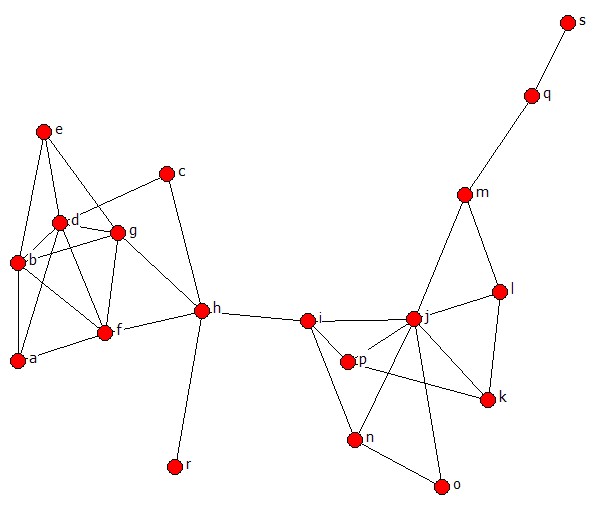
Figure 1. Who knew whom before taking this class. 1. Figure 1 shows a visualization of the network generated by this survey question: "I knew this person before the sna class”. To make it easier, nodes are identified by three-digit ID codes rather than many-character names. Isolates have been removed. a. Construct
a DL file in both NODELIST and EDGELIST format for this network. You should give
the text files different names.
(You can “View | Zoom” on the
picture to see labels clearly.) b. Import both DL files into UCINET and then display them in NetDraw. c. Compare each of your NetDraw visualization to Figure 1. Are they the same (aside from orientation and other cosmetic differences)? If not, fix your DL files to make them so. d. Which one was easier to construct? When do you have to use the other one? 2. Open the following Excel file: OpenAnswers.xls. It contains the ID numbers and answers to three of the demographic questions in which people could type their own responses. Nationality, discipline studied, and languages spoken. We are now going to make attribute files from each of these. Nationality Data a. Focusing just on the Nationality column for now, make a type of file called a VNA file that has the Nationality (and ID Number) for only those nodes in the network you just created. As you do so, merge the various variations of the same nationality into one consistent one. (e.g., US, USA, and American all become one consistent form). For example:
b. Now, load this vna file as attributes into netdraw by clicking on the button with a folder and an A next to it (the Open Attributes icon). Color the nodes by nationality by using the Color Palette Icon. Is there a pattern to who knew each other based on a common nationality? c. Now, export these attributes by choosing “File | Save Data As | UCINET | Attributes” and giving the file an appropriate name. Then display the file in UCINET (using the big D icon on the icon bar or pressing Ctrl-D). What did NetDraw do to help you? Why did it do that? Are you happy with it? Discipline Data d. For Discipline, there is less of the variant spellings problem. Allowing only one discipline per person, make an attribute file for only those the nodes from the network you created in step 1 directly in the UCINET data grid. You will want to put the ID numbers as Labels in the gray shaded area down the rows and some label (e.g., “FieldOfStudy”) in the gray shaded area above the first column of “data” (i.e., the first column that is not the labels for the rows). Remember, since UCINET only accepts numeric data, you will have to translate your attributes to unique numbers and be consistent throughout. Save these attributes by clicking on the disc icon and then load them into NetDraw using the Open Attributes icon. e. Shape the nodes by discipline. Is there a relationship between similar discipline and knowing each other before this class? Languages Data f. Finally, for the languages, create an Excel worksheet where the first row across (starting in column B) is a list of all the unique languages mentioned by anyone (again merging variant spellings). Then down Column A (starting in Row 2) put all the ID numbers from the network you created in step 1. For each of those IDs, put a 1 in the appropriate cell under each language that respondent listed. (You may leave the others blank). g. Once that is completed, select all the data (including the labels in Row 1 and Column A), and copy it to the clipboard with either the “Copy” icon, “Edit | Copy” from the menu, or Ctrl-C. h. Go back to UCINET and open a new spreadsheet and click in the upper most cell (the gray corner cell at the top). Paste your data (with the clipboard icon, Edit | Paste, or Ctrl-V). It should put the labels in the gray cells and the data in the white cells. i. By default, the spreadsheet opens a 30x30 matrix. Your data was probably not that big, so adjust the “Dimensions” values on the right side of the window so that it matches the number of rows (IDs) and columns (Languages) you have. The remaining grid lines should go away. j. If you have 1s and blanks, you should now hit the “Fill” icon on the icon bar. It will fill the blank cells with 0s, and save the file. k. Load this set of attributes into NetDraw. Then, in the control region on the far right, select the Nodes tab and pull down the selection box and show only the nodes that speak a certain language (Hint: Those who do not speak the language will have a value of 0 for that language attribute.) l. Given these three methods of importing attribute data, which do you think is the easiest and least likely to create errors? 3. We are now going to transform that two-mode data to one-mode data of actors by actors, where the values are the counts of languages they speak in common. Do this through Tools | Similarities and choose the Cross Product measure of profile similarity (as discussed yesterday). Run this on the ID by Language matrix you created and name the output file CommonLang. a. Now, load CommonLang into NetDraw. If you look at the Rels tab, a new relation (CommonLang) should appear, you may or may not have others. If you do, make sure that the box next to “CommonLang” is checked and the other(s) are not. This should be a complete graph (every edge that could exist does exist) because everyone should at least have English in common. – But do not worry if they do not. b. Toward the bottom of the control region, there is a row of controls starting with a drop-down list that should display the “>” symbol, followed by a text box with the number 0 in it, followed by small icons with “+” and “-“ on them. If the “>” is not selected in the drop-down list, make sure it is, and then press the “+” button to change the number in the text box to 1. (Alternatively, you can just type 1 in that box.) Now the graph is only showing connections between people who have at least two languages in common. c. Keep increasing the value by pressing on the “+” button. Which pairs of actors speak the most languages in common and how many is that? BORG4CENTConstruct a DL file to build the network pictured below:
(Note: that the data are symmetric.) Remember to think about what would be the most efficient format for your dl file. Ensure your ties are symmetric by using Transform | Symmetrize in UCINET. It reports the number of symmetric pairs and of reciprocated ties. These may not necessarily be the same number. What do you think the difference is between them? Use netdraw to visualize your network to ensure it is correct. If not, open your data in the UCINET spreadsheet to correct it. |
|